Research article
UAV-based deep-learning detection of Podocarpus oleifolius in an Andean montane forest
Mapping a threatened conifer from the air at La Honda, eastern Antioquia, Colombia.
Abstract
Aim of study: to develop and evaluate a UAV-based deep learning approach for detecting and characterizing crowns of the threatened conifer Podocarpus oleifolius in a tropical montane forest.
Area of study: Eastern Antioquia, Colombian Andes.
Material and methods: high-resolution RGB imagery acquired with an unmanned aerial vehicle (UAV) was used to manually delineate tree crowns and train two object-detection models (YOLOv11x and Faster R-CNN). Detection performance was evaluated using standard and ecologically adapted metrics accounting for irregular crown geometry. Detected crowns were further analyzed using geometric indices and spatial point-pattern statistics.
Main results: the YOLOv11x model achieved high detection accuracy (precision = 0.91, recall = 0.84, F1-score = 0.80, mAP@0.5 = 0.864). Faster R-CNN reached optimal performance under relaxed matching criteria (F1-score up to 0.83). A total of 207 P. oleifolius crowns were detected, corresponding to a density of 2.31 crowns ha⁻¹. Crown size and shape were highly heterogeneous, and spatial analyses revealed strongly aggregated distributions persisting across multiple spatial scales.
Research highlights: results demonstrate that UAV imagery combined with deep learning enables reliable, species-focused crown detection in structurally complex montane forests, supporting spatially explicit monitoring of threatened tree species where ground-based surveys are logistically constrained.
Keywords conifer conservationremote sensingtree crown shape
Abbreviations used: GSD (ground sampling distance); IoU (Intersection over Union); m a.s.l. (meters above sea level); PP (Polsby–Popper compactness); SI (Shape Index); UAV (unmanned aerial vehicle).
Introduction
Podocarpus oleifolius D. Don is a montane conifer native to Central and South America, distributed from southern Mexico to Bolivia at elevations ranging from approximately 1,200 to 3,300 m a.s.l., including the highlands of Colombia. Although the species is globally classified as Least Concern due to its broad geographic range and the presence of multiple local populations (Gardner, 2013), its conservation status in the Colombian Andes is considerably more precarious. Extensive historical logging and ongoing forest fragmentation have caused severe population declines, with many remaining individuals confined to small, isolated forest fragments (Álvarez-Díaz et al., 2018).
In Colombia, P. oleifolius is officially listed as Vulnerable under Resolution 0126 of 2024 issued by the Ministry of Environment and Sustainable Development. Accurate detection and identification of remnant individuals therefore represent a conservation priority, as their presence often signals relatively well-preserved montane forest conditions. These habitats typically support assemblages of late-successional plant species, including Ceroxylon, Cedrela, Magnolia, Quercus, Cyathea, as well as members of Lauraceae and Orchidaceae, among others, thereby substantially enhancing the ecological value and conservation significance of these forest remnants.
Traditional biodiversity inventories in tropical forests rely primarily on field-based approaches such as plot censuses and transect surveys. Although these methods provide direct and reliable information on species composition and status, they are costly, labor-intensive, and typically limited to small spatial scales (Garzon-Lopez et al., 2024). Many tropical montane forests are located in steep, remote, and difficult-to-access terrain, where monitoring requires substantial travel and logistical support, increasing costs and often rendering surveys infeasible in regions with limited infrastructure. Beyond logistical constraints, biodiversity monitoring in many developing countries is further hindered by chronic underfunding, limited institutional capacity, and a severe shortage of trained taxonomists and conservation professionals. Collectively, these challenges — high costs, limited human resources, and restricted accessibility — limit the ability of traditional field-based approaches to deliver timely, large-scale biodiversity data, thereby constraining effective conservation planning in tropical montane forests under rapidly changing environmental conditions.
Recent advances in remote sensing provide a transformative alternative for biodiversity monitoring and conservation. Unmanned aerial vehicles (UAVs) equipped with high-resolution cameras and sensors now enable efficient data acquisition across rugged and inaccessible terrain (Abreu-Dias et al., 2025). In particular, lightweight UAV platforms such as the DJI Mavic series have become widely adopted for forest surveys due to their availability, operational flexibility, and ability to capture imagery at centimeter-level spatial resolution (Leidemer et al., 2025). When combined with machine learning–based image analysis, UAVs can substantially reduce the time and costs associated with cataloging tree species across complex landscapes. Accordingly, recent studies in tropical ecosystems increasingly employ drone-based approaches to map species distributions in support of forest management and conservation initiatives (Albuquerque et al., 2022; Moura et al., 2021). For example, a UAV-based inventory of Mauritia flexuosa conducted for management planning achieved a 99% reduction in survey costs compared to traditional field methods (USD 5 ha⁻¹ versus USD 411 ha⁻¹), while simultaneously improving spatial coverage and operational efficiency (Tagle Casapia et al., 2025).
Deep learning–based object detection algorithms now play a central role in extracting ecological information from aerial imagery, consistently outperforming traditional image analysis techniques in both accuracy and computational efficiency (Topgül et al., 2024). Among these approaches, models from the You Only Look Once (YOLO) family represent single-stage detectors that perform object localization and classification in a single forward pass through a convolutional neural network. By eliminating the separate region proposal stage and directly predicting bounding boxes and class probabilities across the image grid, YOLO models achieve markedly higher detection speeds without sacrificing accuracy (Hussain, 2023). This combination of speed and performance enables real-time or near-real-time processing, which is particularly advantageous for UAV-based applications and on-board analysis. Consequently, YOLO architectures have been widely adopted in domains requiring rapid and high-frequency object recognition, including agriculture and forestry (Ali & Zhang, 2024). In the context of UAV-based tree identification, these characteristics allow for rapid surveying and automated detection of individual trees, supporting timely decision-making in forest monitoring and conservation planning.
Despite these advantages, identifying individual tree species from UAV imagery in tropical forests remains a formidable challenge. Tropical forests are characterized by dense, multi-layered canopies and high species diversity, which complicate species-level discrimination from aerial data (Pereira Martins-Neto et al., 2023). Overlapping crowns and mixed vegetation strata frequently obscure understory and mid-canopy trees, making it difficult to delineate individual crowns and reliably separate neighboring individuals in aerial imagery (Ball et al., 2023). In addition, many co-occurring species exhibit similar spectral and textural signatures in RGB imagery, particularly in evergreen tropical forests where limited phenological variation reduces contrast among species (Zhong et al., 2024). The widespread presence of lianas and epiphytes further modifies crown appearance, increasing structural complexity and potentially confounding automated classification. As a result, even when high-resolution imagery is available, distinguishing P. oleifolius from sympatric species remains prone to error. Consistent with these challenges, previous UAV-based tree classification studies have reported highly variable accuracy, ranging from approximately 40% to over 90%, depending on image resolution, number of target species, and forest structural complexity (Huang et al., 2024).
In this context, the present study aims to develop and evaluate a UAV-based approach for the detection and identification of Podocarpus oleifolius in a tropical montane forest of Antioquia, Colombia. Successful mapping of this species will not only contribute to improved assessments of its local conservation status and population demography but will also help clarify the potential and limitations of drone-based species monitoring in structurally complex tropical forests. Ultimately, this work supports the development of more detailed forest inventories and informed conservation strategies for Andean montane forest remnants by integrating advanced remote sensing techniques with pressing conservation priorities.
Material and methods
Study area
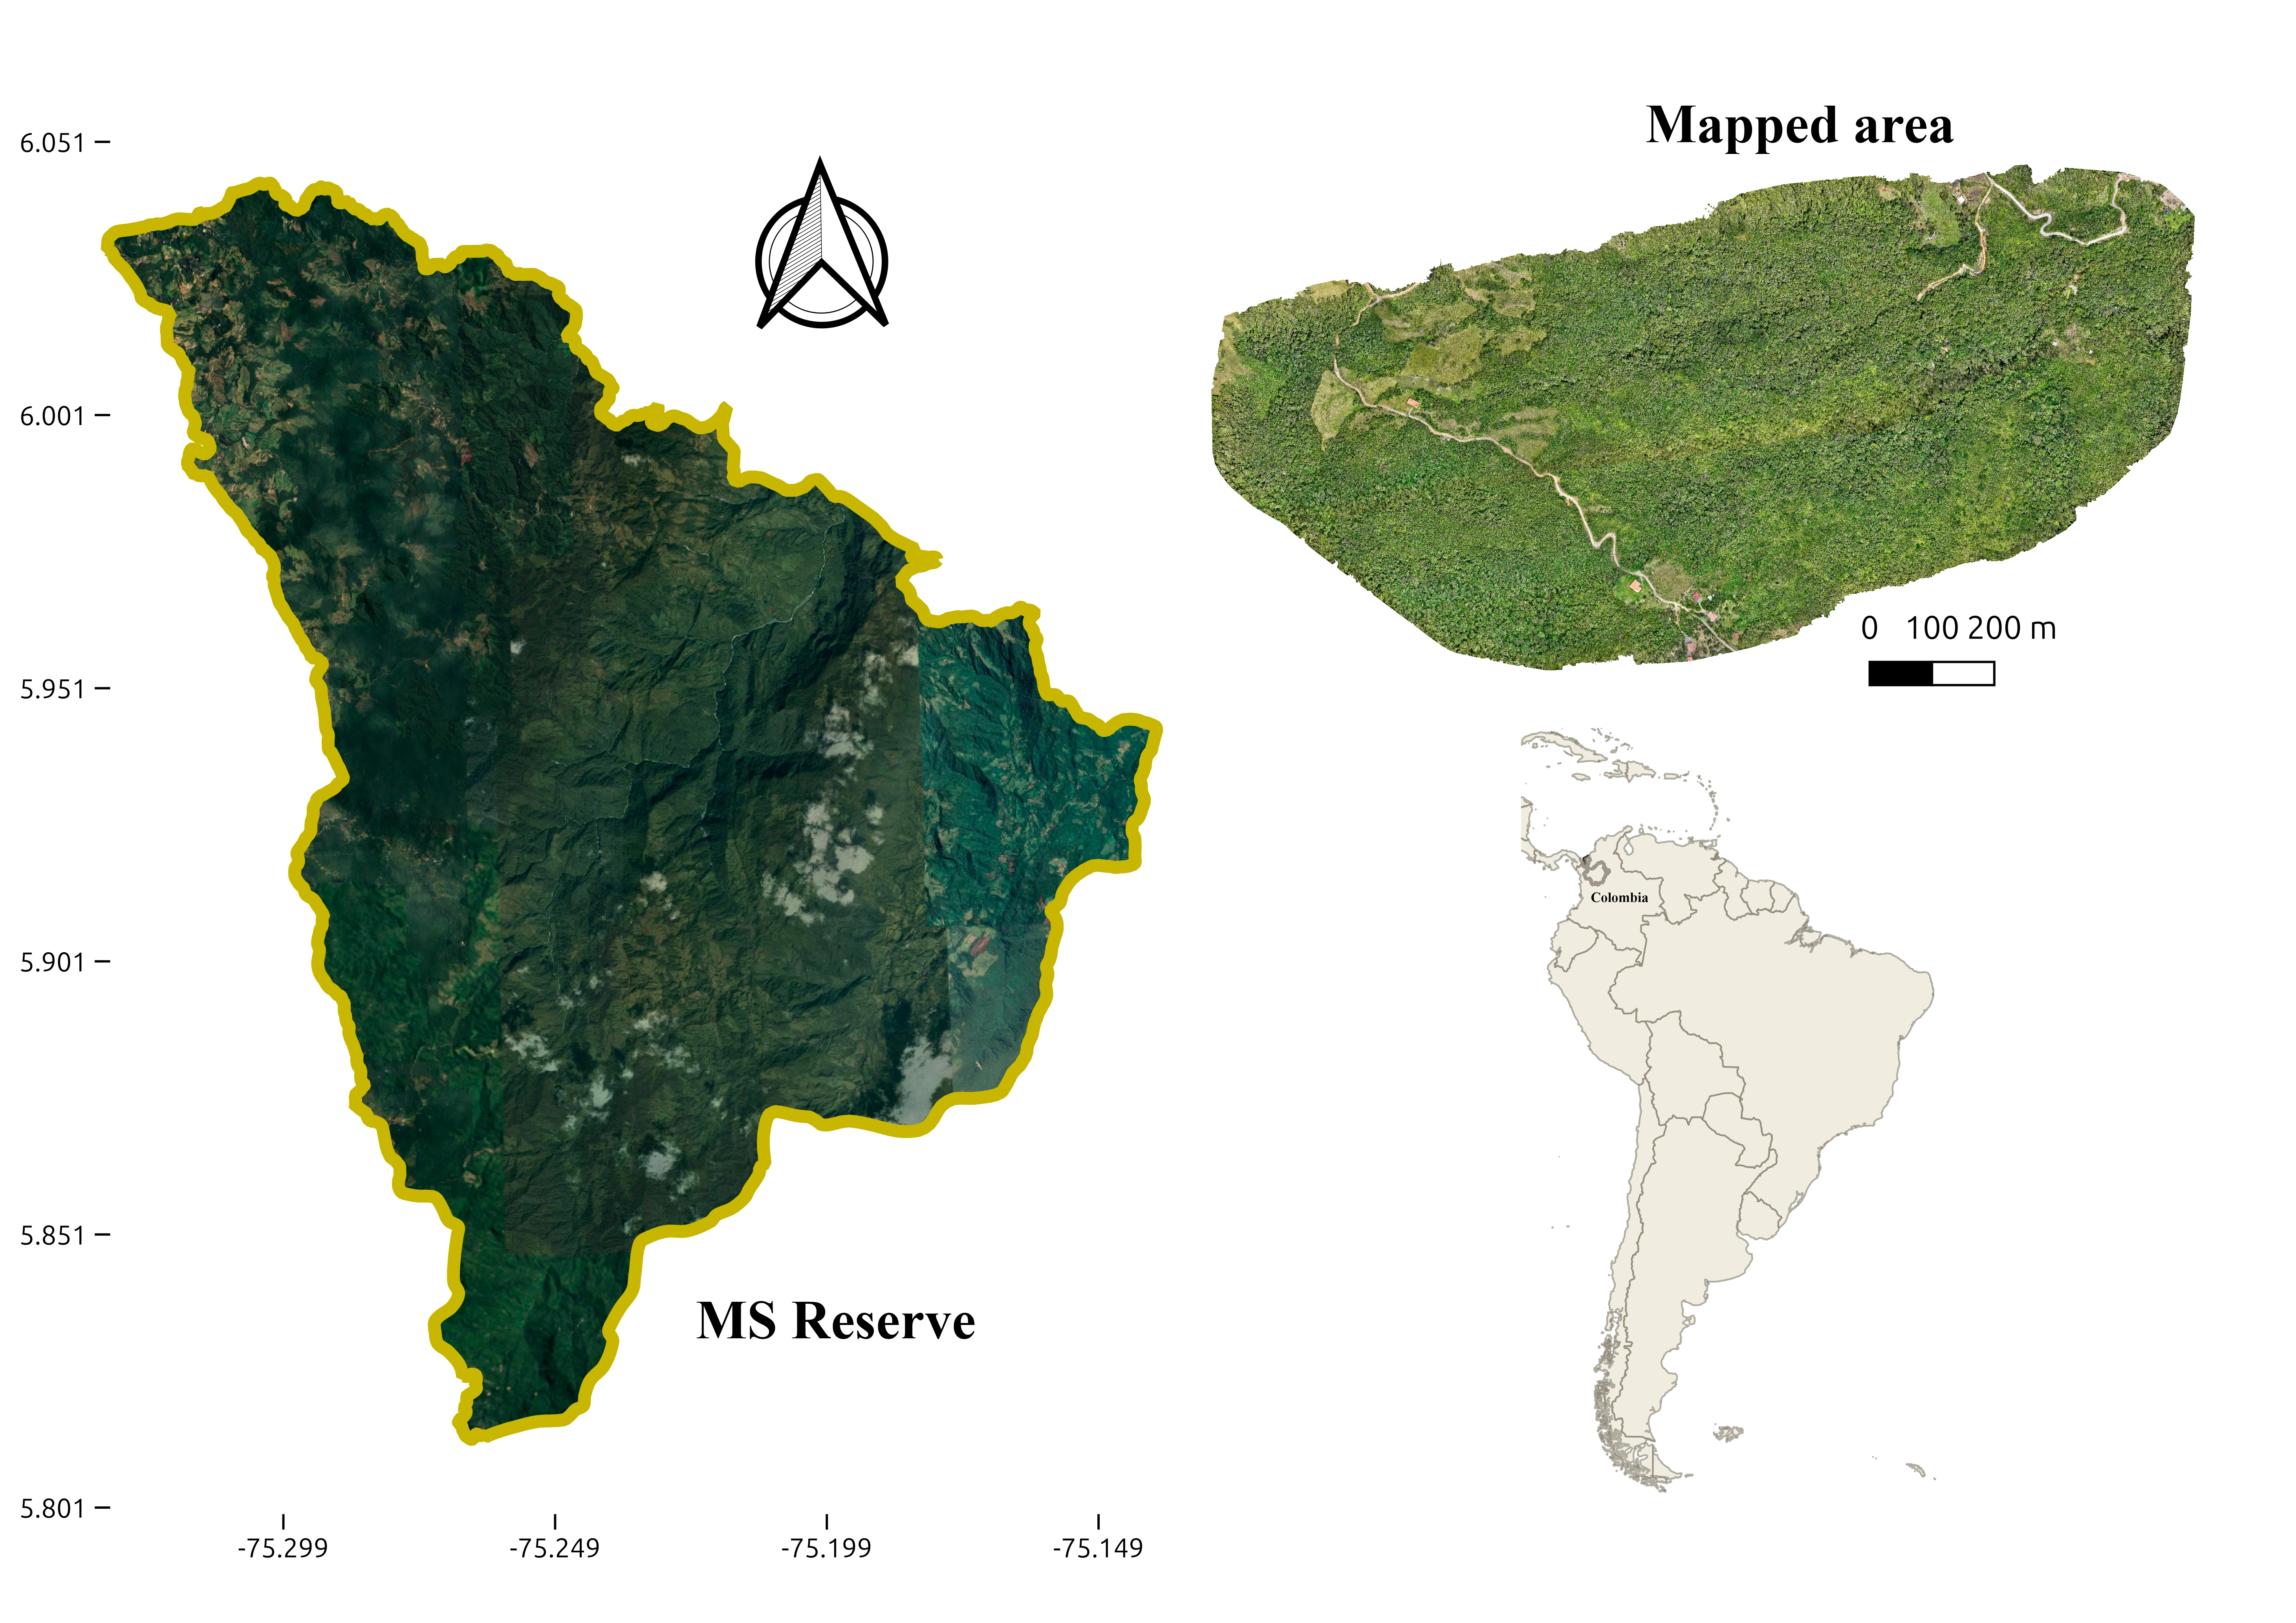
The Regional Protective Forest Reserve of the Canyons of the Melcocho and Santo Domingo Rivers (hereafter MS Reserve) is located in the municipality of Carmen de Viboral, within the Central Cordillera of eastern Antioquia, Colombia. The reserve covers an area of 26,533 ha and spans an altitudinal gradient from 706 to 2,937 m a.s.l. Mean annual temperatures range between 16 and 35 °C, while annual precipitation varies from approximately 3,073 to 5,120 mm.
The MS Reserve encompasses a wide range of ecological zones, including Very Humid Forest, Lower Montane Very Humid Forest, Premontane Pluvial Forest, Premontane Very Humid Forest, Lower Montane Pluvial Forest, and Montane Pluvial Forest. These habitats support high biodiversity and include key conservation areas such as water sources and aquifers that provide critical ecosystem services (CORNARE, 2016; see figures in Montoya-López & Lehnert, 2024).
The area mapped in this study covered 89.5 ha, located at an average elevation of 2,430 m a.s.l. (5°55′15.2″ N, 75°17′19.6″ W).
UAV data acquisition
RGB imagery was acquired using a DJI Mavic 3 Enterprise unmanned aerial vehicle equipped with a 4/3-inch CMOS sensor, a 20 MP camera, and a mechanical shutter. Flight missions were conducted in October 2024 under clear, sunny conditions to minimize illumination variability and shadow effects.
Image acquisition was performed using terrain-following flights at an altitude of 70 m above ground level, resulting in an orthomosaic ground sampling distance of approximately 1.88 cm pixel⁻¹. Both frontal and lateral image overlaps were set to 80% to ensure sufficient redundancy for photogrammetric reconstruction. Orthophotos were generated using the Biodrone online processing platform with default processing parameters.
Determination of Podocarpus oleifolius detectability
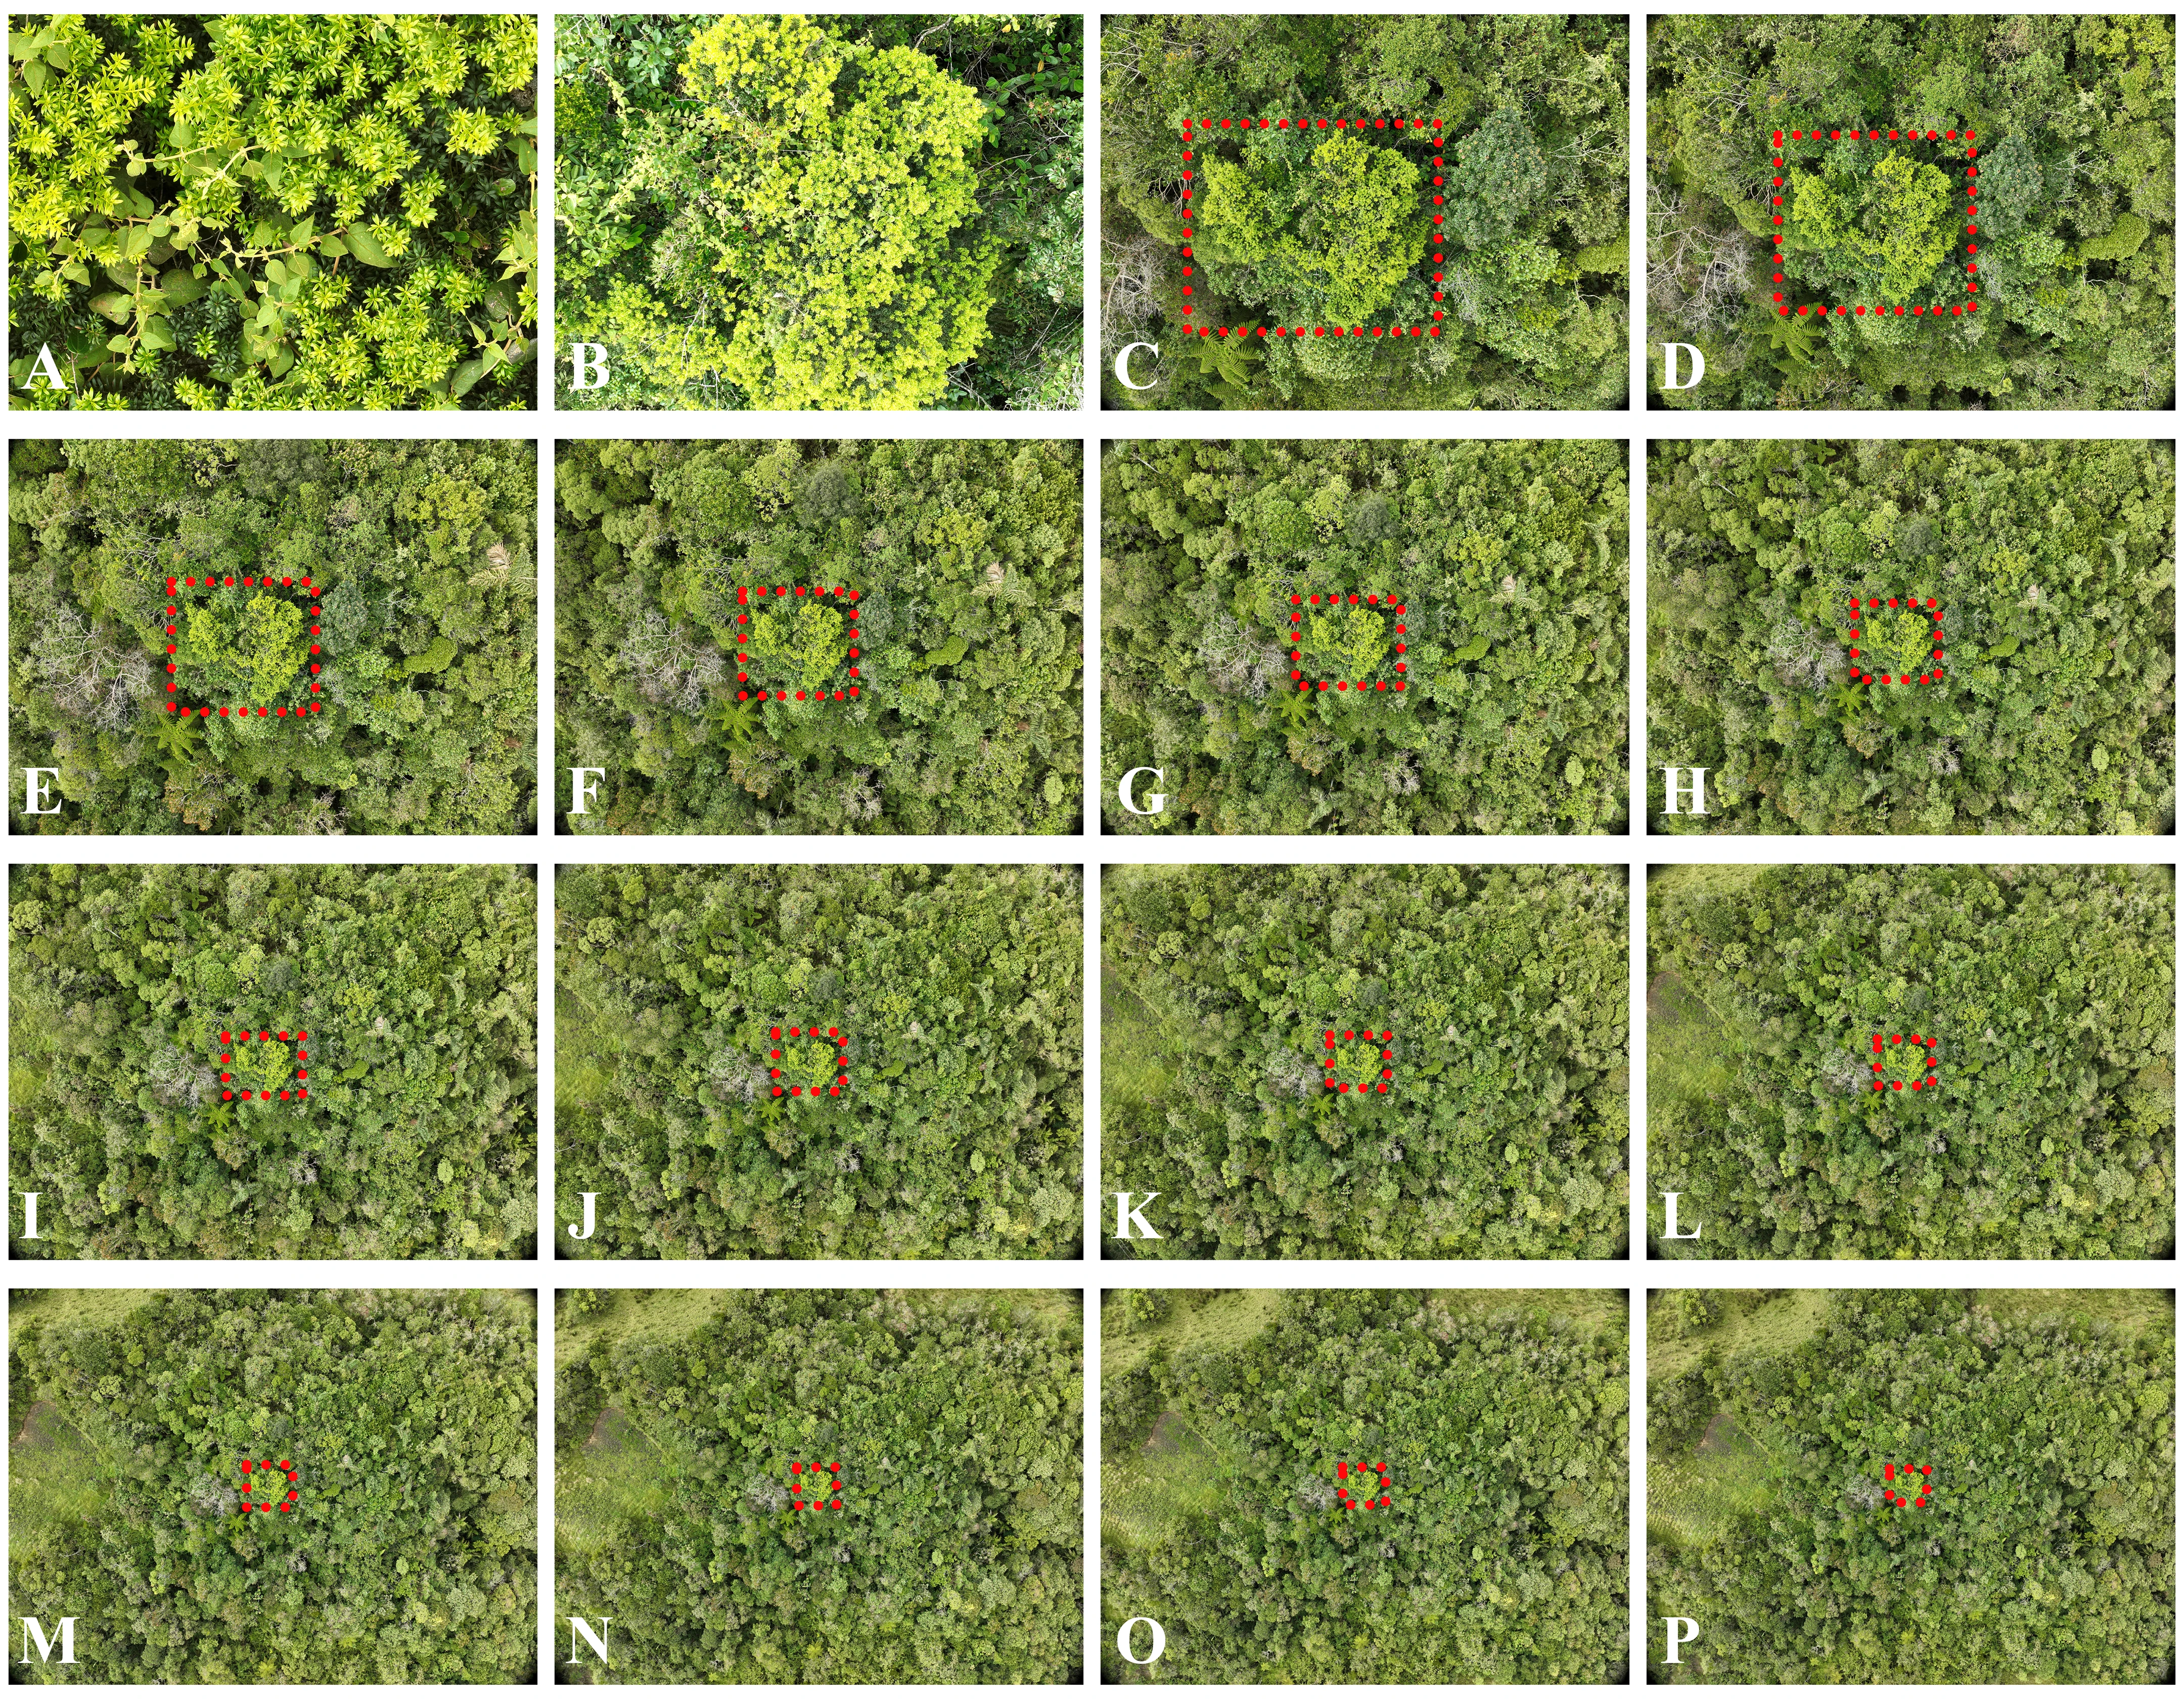
To determine the optimal flight altitude for reliable species identification, aerial photographs of Podocarpus oleifolius individuals were collected at 5 m intervals, ranging from 5 to 75 m above the canopy. Each image was visually inspected to assess species detectability based on crown coloration, shape, and textural characteristics.
An altitude of 70 m above the canopy was identified as the optimal compromise between spatial resolution and survey efficiency, representing the maximum height at which P. oleifolius could be consistently and confidently distinguished from surrounding vegetation.
Dataset preparation
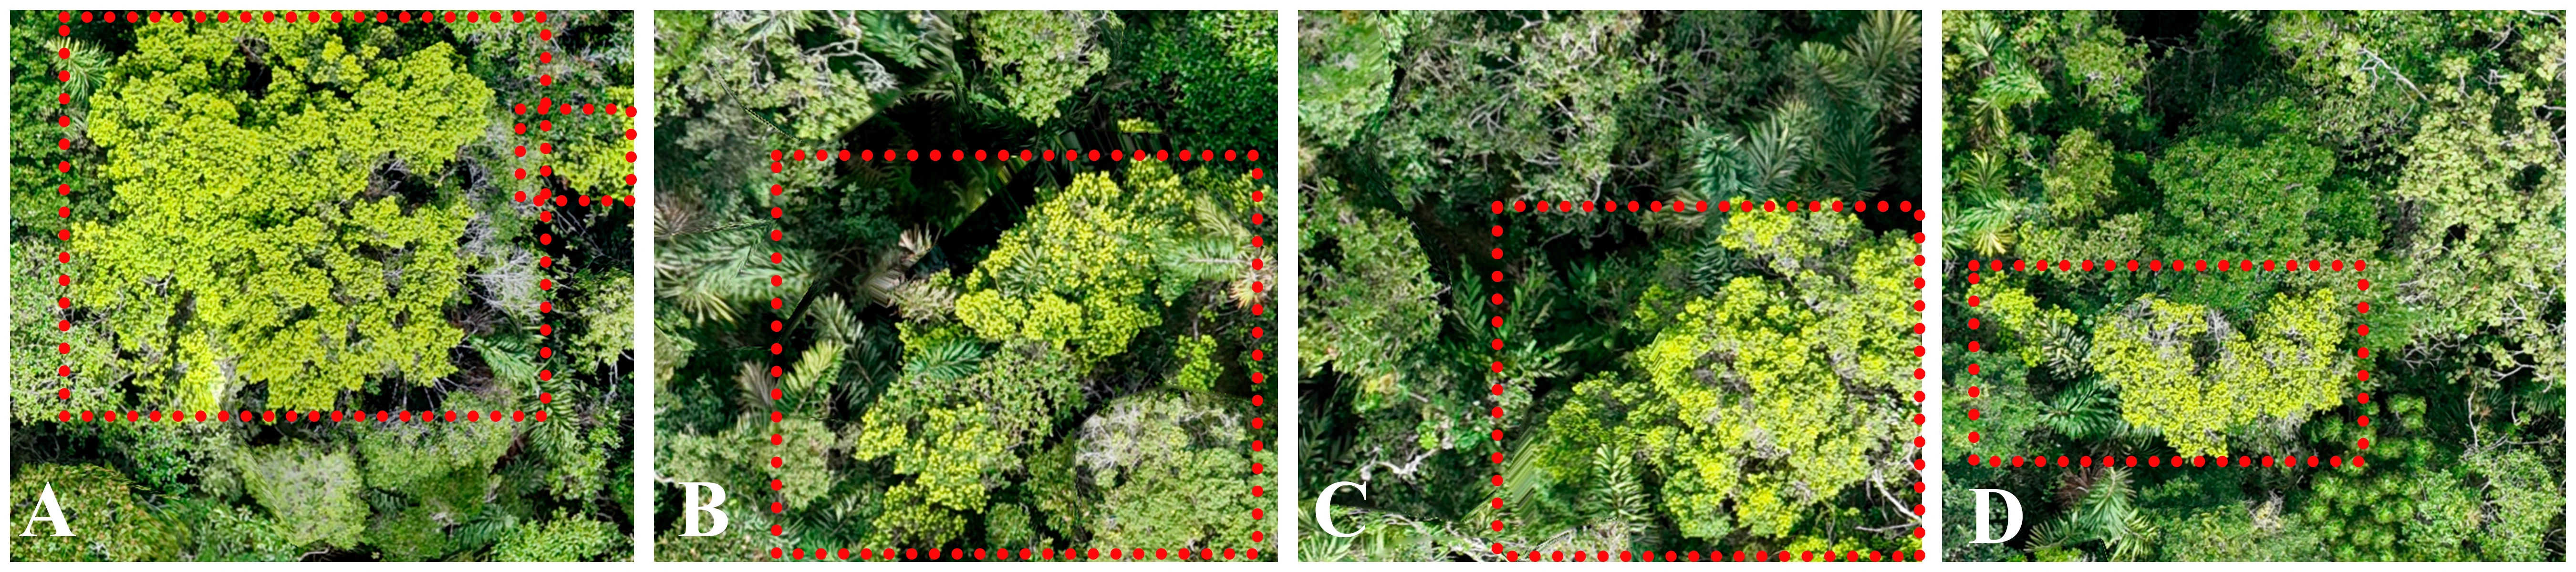
A two-step annotation workflow was employed to construct the training dataset. First, orthophotos were imported into QGIS Desktop version 3.34.4, where a polygon shapefile was manually digitized to delineate the crowns of all P. oleifolius individuals within the 89.5 ha study area.
In the second step, the georeferenced orthophoto (GeoTIFF format) was partitioned into non-overlapping tiles of 640 × 640 pixels using the Rasterio library in Python. The polygon shapefile was subsequently converted into YOLO-compatible bounding box annotations for each tile. Finally, all bounding boxes were visually inspected, corrected where necessary, and validated using the CVAT online annotation platform to ensure consistency and accuracy across the training dataset.
Data augmentation
To increase dataset diversity and improve model generalization, a custom data augmentation pipeline was implemented using the Albumentations library. Ten distinct augmentation strategies were applied to each training image and its corresponding annotation, generating ten augmented variants per original sample (Table 1). The applied transformations included geometric modifications (rotation, shear, affine transformations, perspective warping, and horizontal and vertical flipping), photometric adjustments (hue–saturation shifts, brightness and contrast variation, RGB shifts, and channel shuffling), local distortions (motion blur, Gaussian noise, dropout, and defocus), and tonal alterations (grayscale conversion, histogram equalization, posterization, and Contrast Limited Adaptive Histogram Equalization).
To better emulate field conditions, additional illumination effects such as artificial shadows, sun flares, and vignettes were introduced. Bounding boxes were dynamically adjusted during augmentation to maintain annotation accuracy, with a minimum object visibility threshold of 10%. All augmented images and corresponding YOLO-format labels were exported into a structured dataset for subsequent model training.
Table 1. Augmentations applied to the training dataset.
| # | Description |
|---|---|
| 1 | Strong rotation + shear (geometry-focused) |
| 2 | Perspective warp (tilt) + light jitter |
| 3 | Horizontal flip + coarse dropout (simulate occlusion) |
| 4 | Vertical flip + motion blur (simulate platform motion) |
| 5 | Strong hue–saturation–value shift + brightness/contrast |
| 6 | CLAHE + sharpen (local contrast + edges) |
| 7 | RGB shift + channel shuffle (sensor/colour variance) |
| 8 | Blur + noise (defocus + sensor noise) |
| 9 | Grayscale + equalize/posterize (extreme tonal change) |
| 10 | Sun flare / vignette style lighting + small jitter |
Model training and evaluation
Model training was conducted using Google Colab equipped with an NVIDIA A100 GPU (40 GB VRAM) and 83.5 GB of system memory. The training dataset consisted of 145 original image tiles containing P. oleifolius crown annotations, along with 1,450 augmented images derived from these originals. The validation dataset comprised 63 original tiles and did not include any augmented samples.
YOLOv11
A YOLOv11x model (Ultralytics) was trained to detect P. oleifolius crowns using an input resolution of 1024 × 1024 pixels over 250 training epochs. Automatic mixed precision was enabled to improve computational efficiency. To ensure reproducibility, a fixed random seed (123) was applied, and early stopping with a patience of 30 epochs was implemented to reduce overfitting.
Model performance was evaluated using standard object detection metrics, including precision, recall, Intersection over Union, and mean Average Precision, calculated both at IoU = 0.5 (mAP@0.5) and across the range IoU = 0.5–0.95 (mAP@0.5:0.95).
Faster R-CNN
For Faster R-CNN, a custom PyTorch Dataset class was implemented to
convert YOLO-format annotations into pixel-based bounding boxes and to
return image–target pairs compatible with the model. Data augmentation was
applied using Albumentations and included random flips, brightness and
contrast adjustments, resizing, and padding to a standardized input size of
1024 × 1024 pixels.
The base architecture, torchvision.models.detection.fasterrcnn_resnet50_fpn,
was initialized with weights pretrained on the COCO dataset. The
classification head was replaced to predict two classes: background
(implicitly handled by torchvision) and Podocarpus oleifolius crowns. Data
loaders were configured with a batch size of 2, a custom collate function,
and two worker processes. Model optimization was performed using the AdamW
optimizer with a step learning-rate scheduler that reduced the learning rate
by a factor of 0.5 every five epochs.
Training and validation loops computed standard Faster R-CNN loss components (classification loss, bounding box regression loss, objectness loss, and region proposal network loss). The model achieving the lowest validation loss over 15 epochs was retained and used for prediction on the validation dataset. Predictions with confidence scores above 0.5 were visualized by overlaying bounding boxes and class labels on the input images.
For quantitative evaluation, YOLO-format annotations were converted to COCO-compliant JSON files, with bounding boxes expressed in pixel units, enabling computation of mAP and recall using the pycocotools framework. Recognizing the irregular morphology of P. oleifolius crowns and the inherent uncertainty in manual annotations, model evaluation was further extended using alternative matching criteria: (i) a relaxed IoU threshold of ≥ 0.30; (ii) a "center-hit" criterion, whereby a detection was considered correct if its centroid fell within a ground-truth bounding box; and (iii) a dilated IoU approach, in which ground-truth boxes were expanded by 15% on each side prior to overlap calculation. Each criterion was evaluated across a range of confidence thresholds, with optimal operating points reported in terms of F1-score, precision, and recall.
Geometric and spatial indices
Crown morphology and spatial distribution of Podocarpus oleifolius were quantified using a suite of geometric indices and spatial statistics computed in QGIS version 3.34. All metrics were derived from manually digitized crown polygons projected in a planar coordinate system (meters).
For each crown polygon, the following metrics were calculated: area (A, m²), the total surface enclosed by the crown polygon; perimeter (P, m), the length of the crown boundary; the Shape Index, SI = P / (2√(πA)), which quantifies deviation from circularity (SI = 1 for a perfect circle); the Polsby–Popper compactness index, PP = (4πA) / P², ranging from 0 for elongated or irregular shapes to 1 for a perfect circle; the fractal dimension (D), estimated using a box-counting approach, with higher values indicating increased boundary complexity and irregularity; and orientation (θ), the azimuth of the longest axis of the minimum bounding rectangle, constrained to the interval 0° to 180°.
Spatial arrangement of crowns was analyzed using crown centroids and second-order spatial statistics. Ripley's K function was computed with border correction as K(r) = (A / (n · nᵢₙₜ)) ΣᵢΣⱼ I(dᵢⱼ ≤ r), where A is the study area, n the total number of points, nᵢₙₜ the number of points at least r from the boundary, and dᵢⱼ the distance between points i and j. To stabilize variance and facilitate interpretation, K(r) was transformed into L(r) = √(K(r)/π) and H(r) = L(r) − r, where positive values indicate clustering and negative values indicate dispersion.
Directional variability of crown orientation was summarized using Shannon entropy. Crown orientations were grouped into 10° angular bins, and entropy was calculated as H = − Σ pᵢ ln(pᵢ), normalized as Hₙₒᵣₘ = H / ln(k), with pᵢ the proportion of crowns in bin i and k the number of bins. Lower entropy values indicate strong directional alignment, whereas higher values indicate random or isotropic orientation patterns.
To complement point-pattern analyses, nearest-neighbour analysis and the Morisita index were applied. The Morisita index was computed as Iₚ = (n Σ xᵢ (xᵢ − 1)) / (N (N − 1)), where n is the number of quadrats (50 × 50 m), xᵢ the number of individuals in the i-th quadrat, and N the total number of individuals. Values of Iₚ close to 1 indicate a random distribution, values > 1 aggregation, and values < 1 uniformity.
Environmental gradient
To assess the influence of environmental gradients on crown morphology, elevation, slope, and aspect were extracted from a 30 m resolution SRTM digital elevation model of the study area using QGIS. Crown centroids derived from digitized polygons were spatially intersected with the DEM to assign each individual tree corresponding elevation and slope values, while slope aspect was extracted as a circular variable spanning 0–360°.
Crown-level geometric metrics (area, compactness, and fractal dimension) were evaluated in relation to topographic variables using Spearman rank correlation analyses to assess potential monotonic relationships between morphology and terrain. Orientation patterns were further analyzed by binning crown orientations into 10° intervals and computing Shannon entropy normalized by the number of bins. This framework enabled evaluation of whether microtopographic variation in elevation, slope, or aspect systematically influenced crown size, shape, or orientation within the stand.
Results
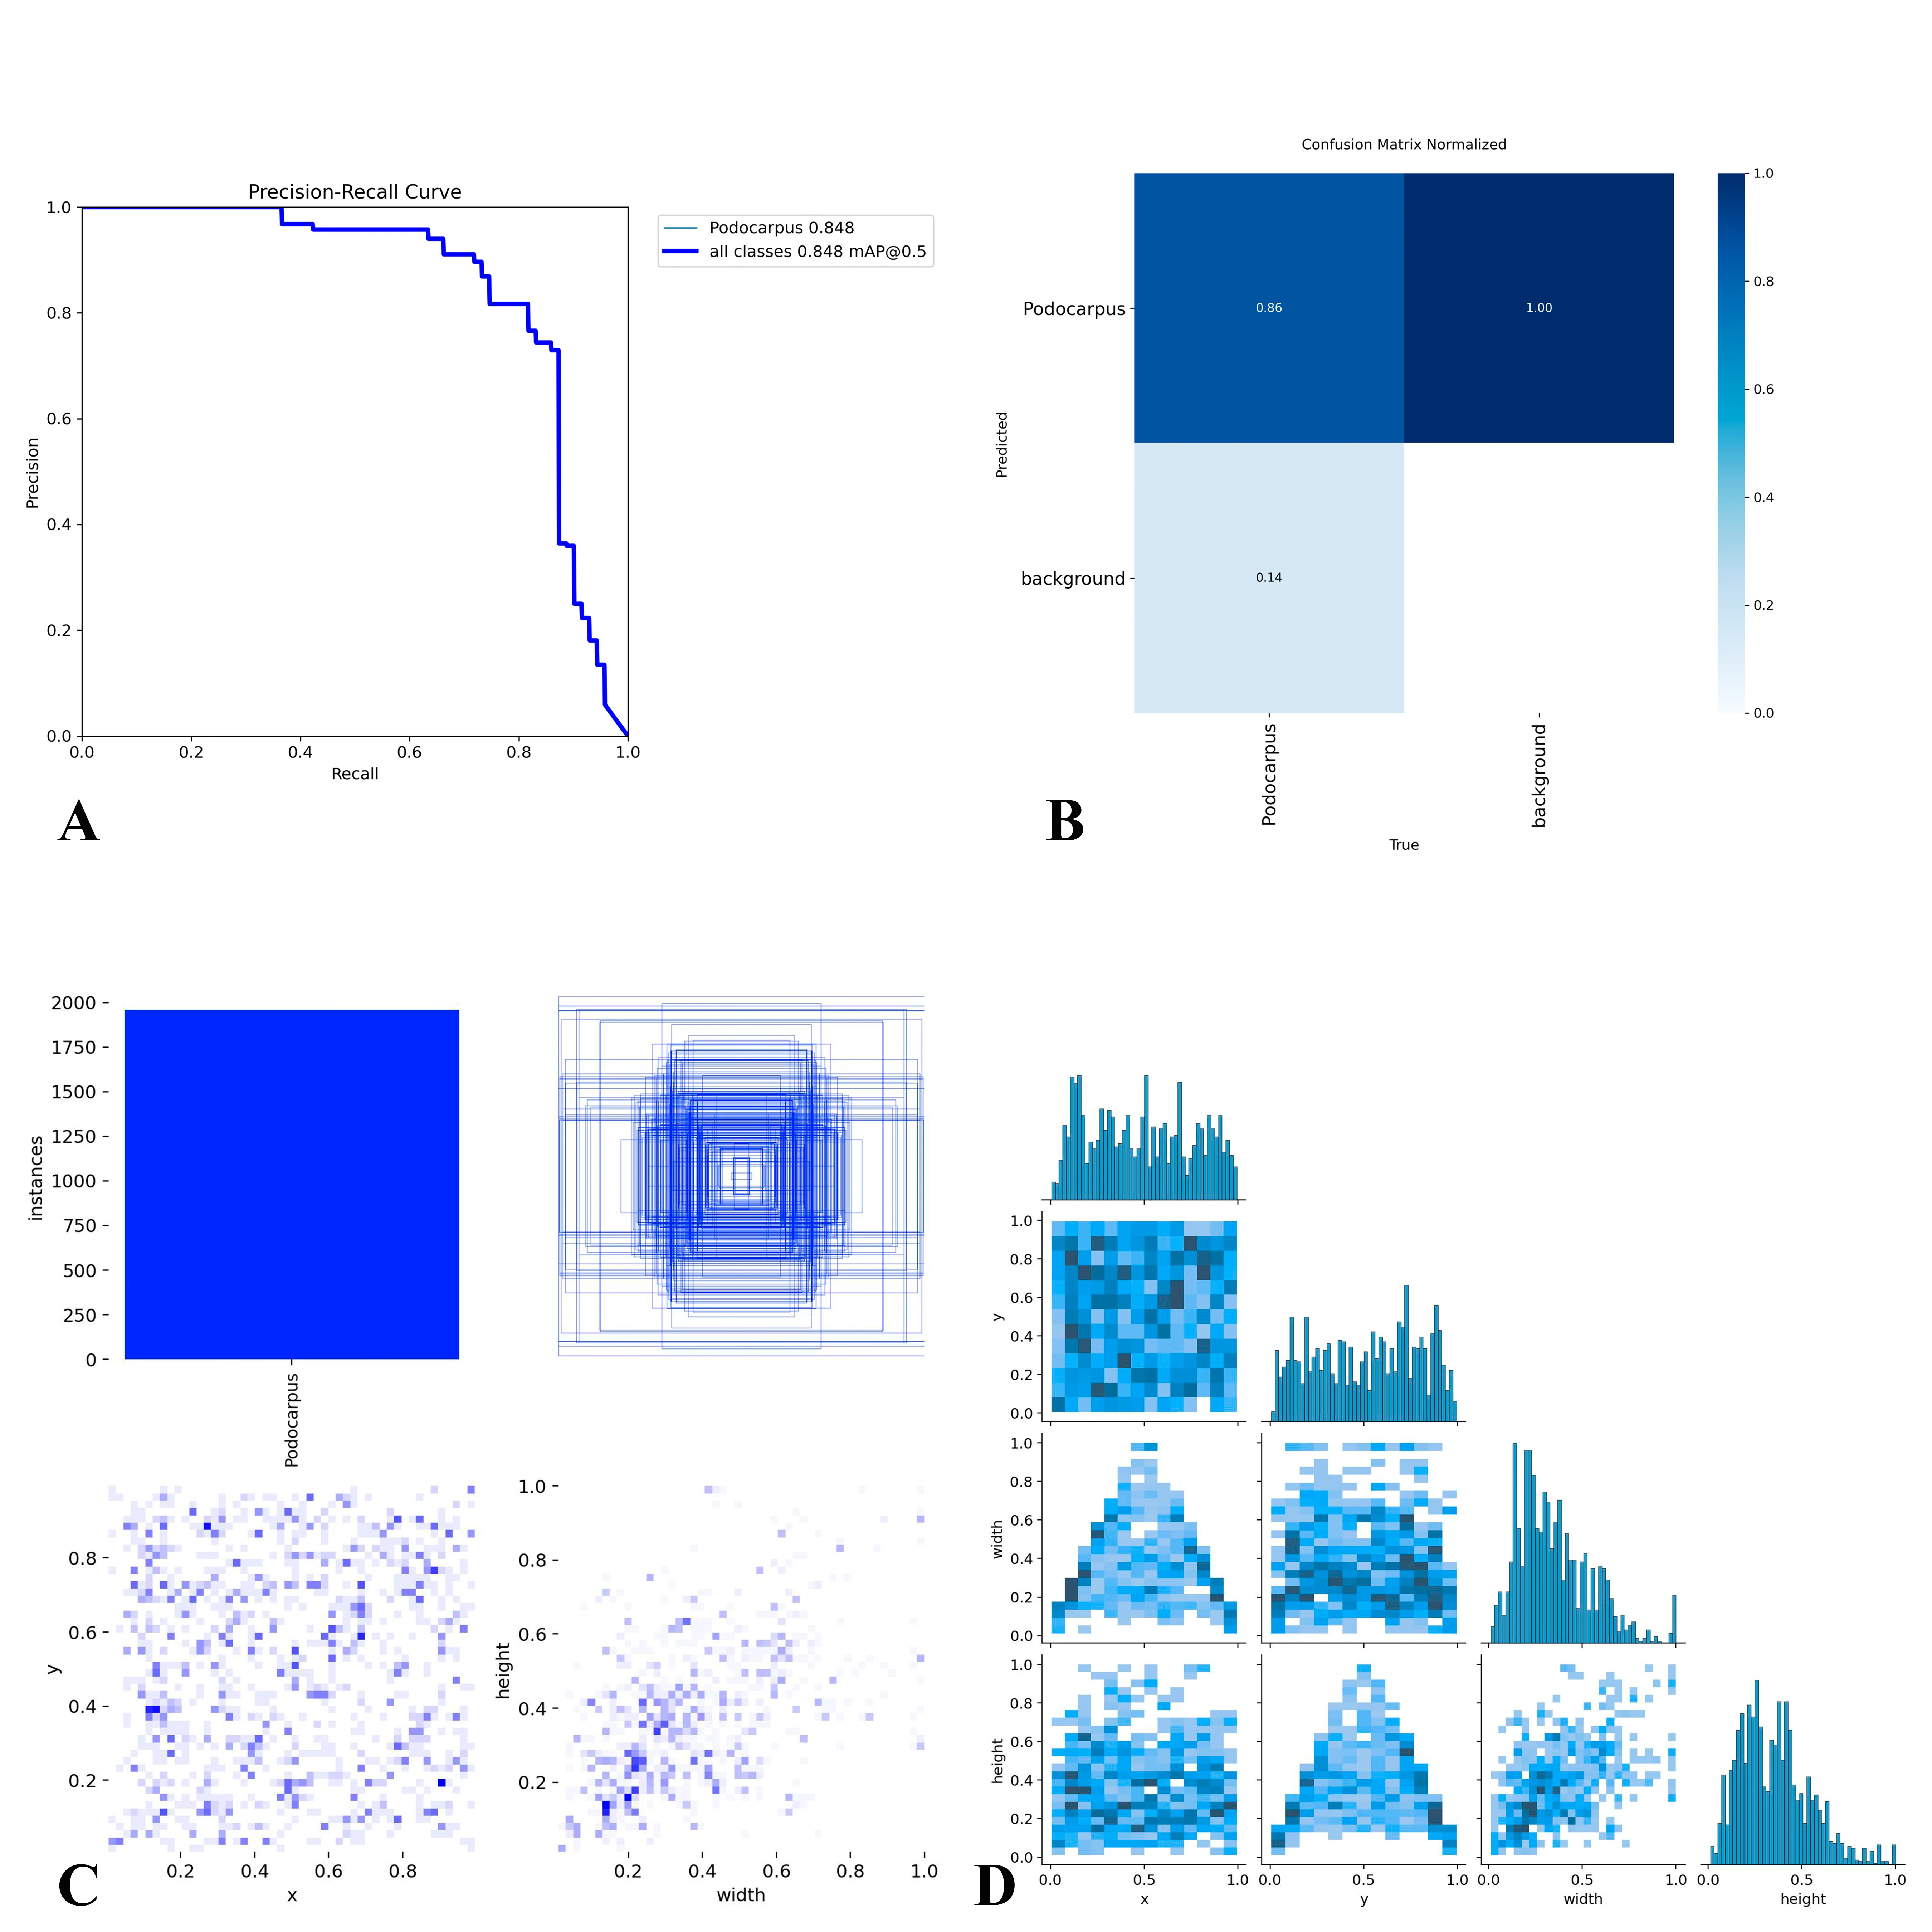
The YOLOv11x model trained for detection of Podocarpus oleifolius crowns demonstrated robust and stable performance across all evaluation metrics. Training losses decreased steadily and converged over time, with box loss declining from 1.8 to 0.94, classification loss from 4.2 to approximately 1.2, and distribution focal loss from 2.2 to 1.4. Validation losses stabilized at slightly higher values (box ≈ 1.4, classification ≈ 1.3, distribution focal loss ≈ 1.9), indicating good convergence without clear evidence of overfitting.
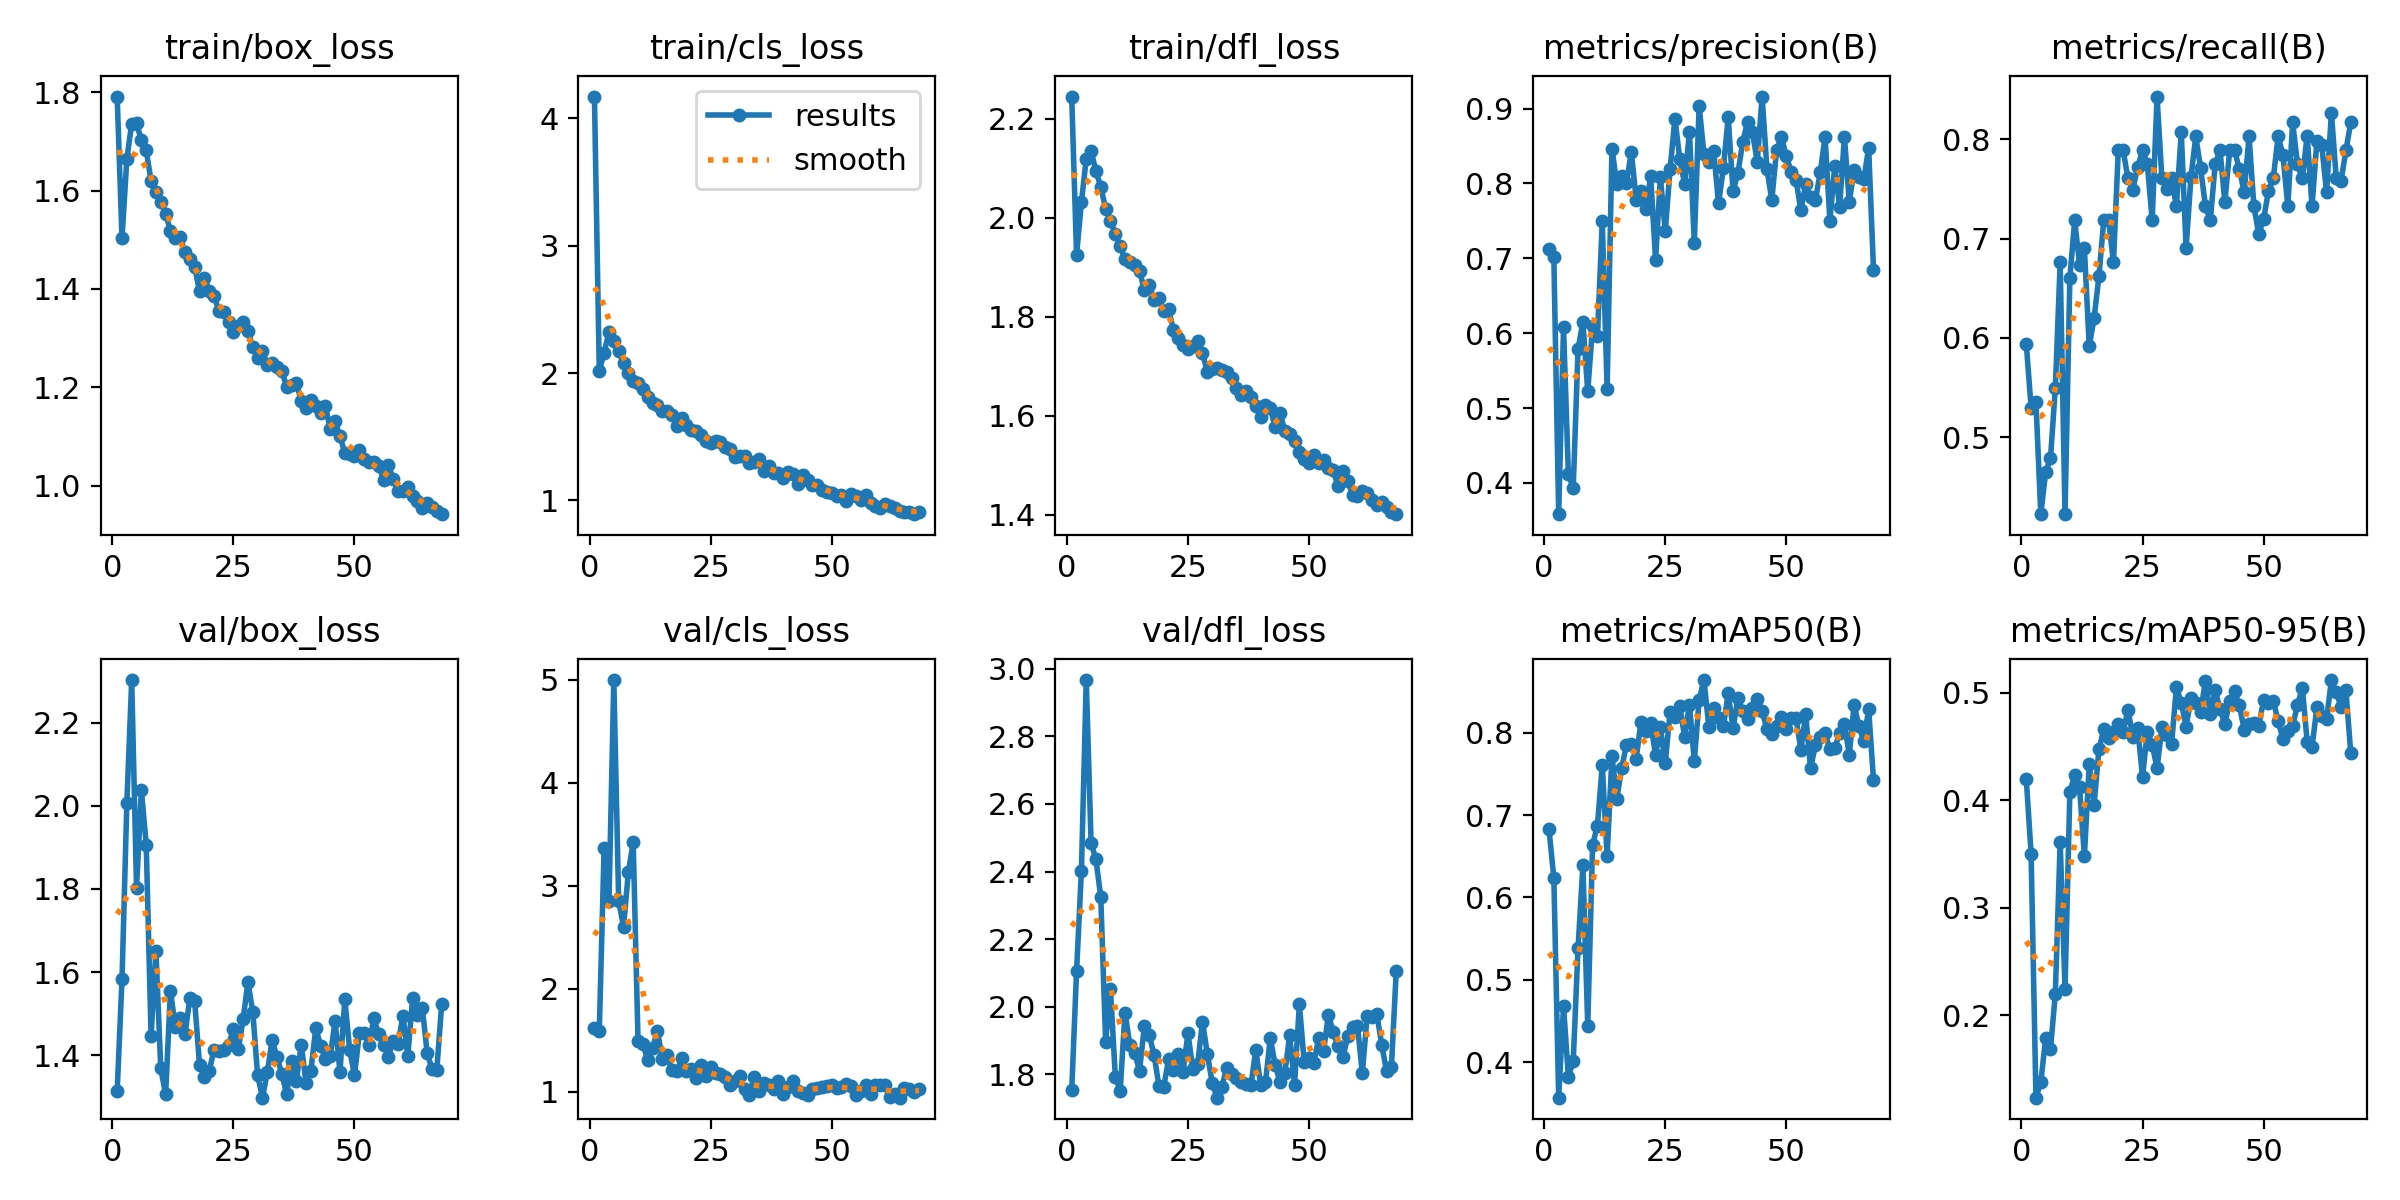
Model precision increased to a maximum of 0.91 (mean = 0.77), while recall peaked at 0.84 (mean = 0.72). The highest F1-score (0.80) was achieved at a confidence threshold of 0.455. Detection accuracy was further supported by mean Average Precision values of 0.864 at IoU = 0.5 and 0.51 across IoU thresholds ranging from 0.5 to 0.95.
Confusion matrix analysis indicated that 86% of annotated P. oleifolius crowns were correctly identified, with 14% missed and a low rate of false positives relative to background predictions, reflecting a conservative detection behaviour. The normalized confusion matrix value of one for the background versus Podocarpus class reflects that the validation dataset contained annotations exclusively for positive instances. Analysis of label distributions confirmed that bounding box sizes and spatial positions were well represented across the dataset.
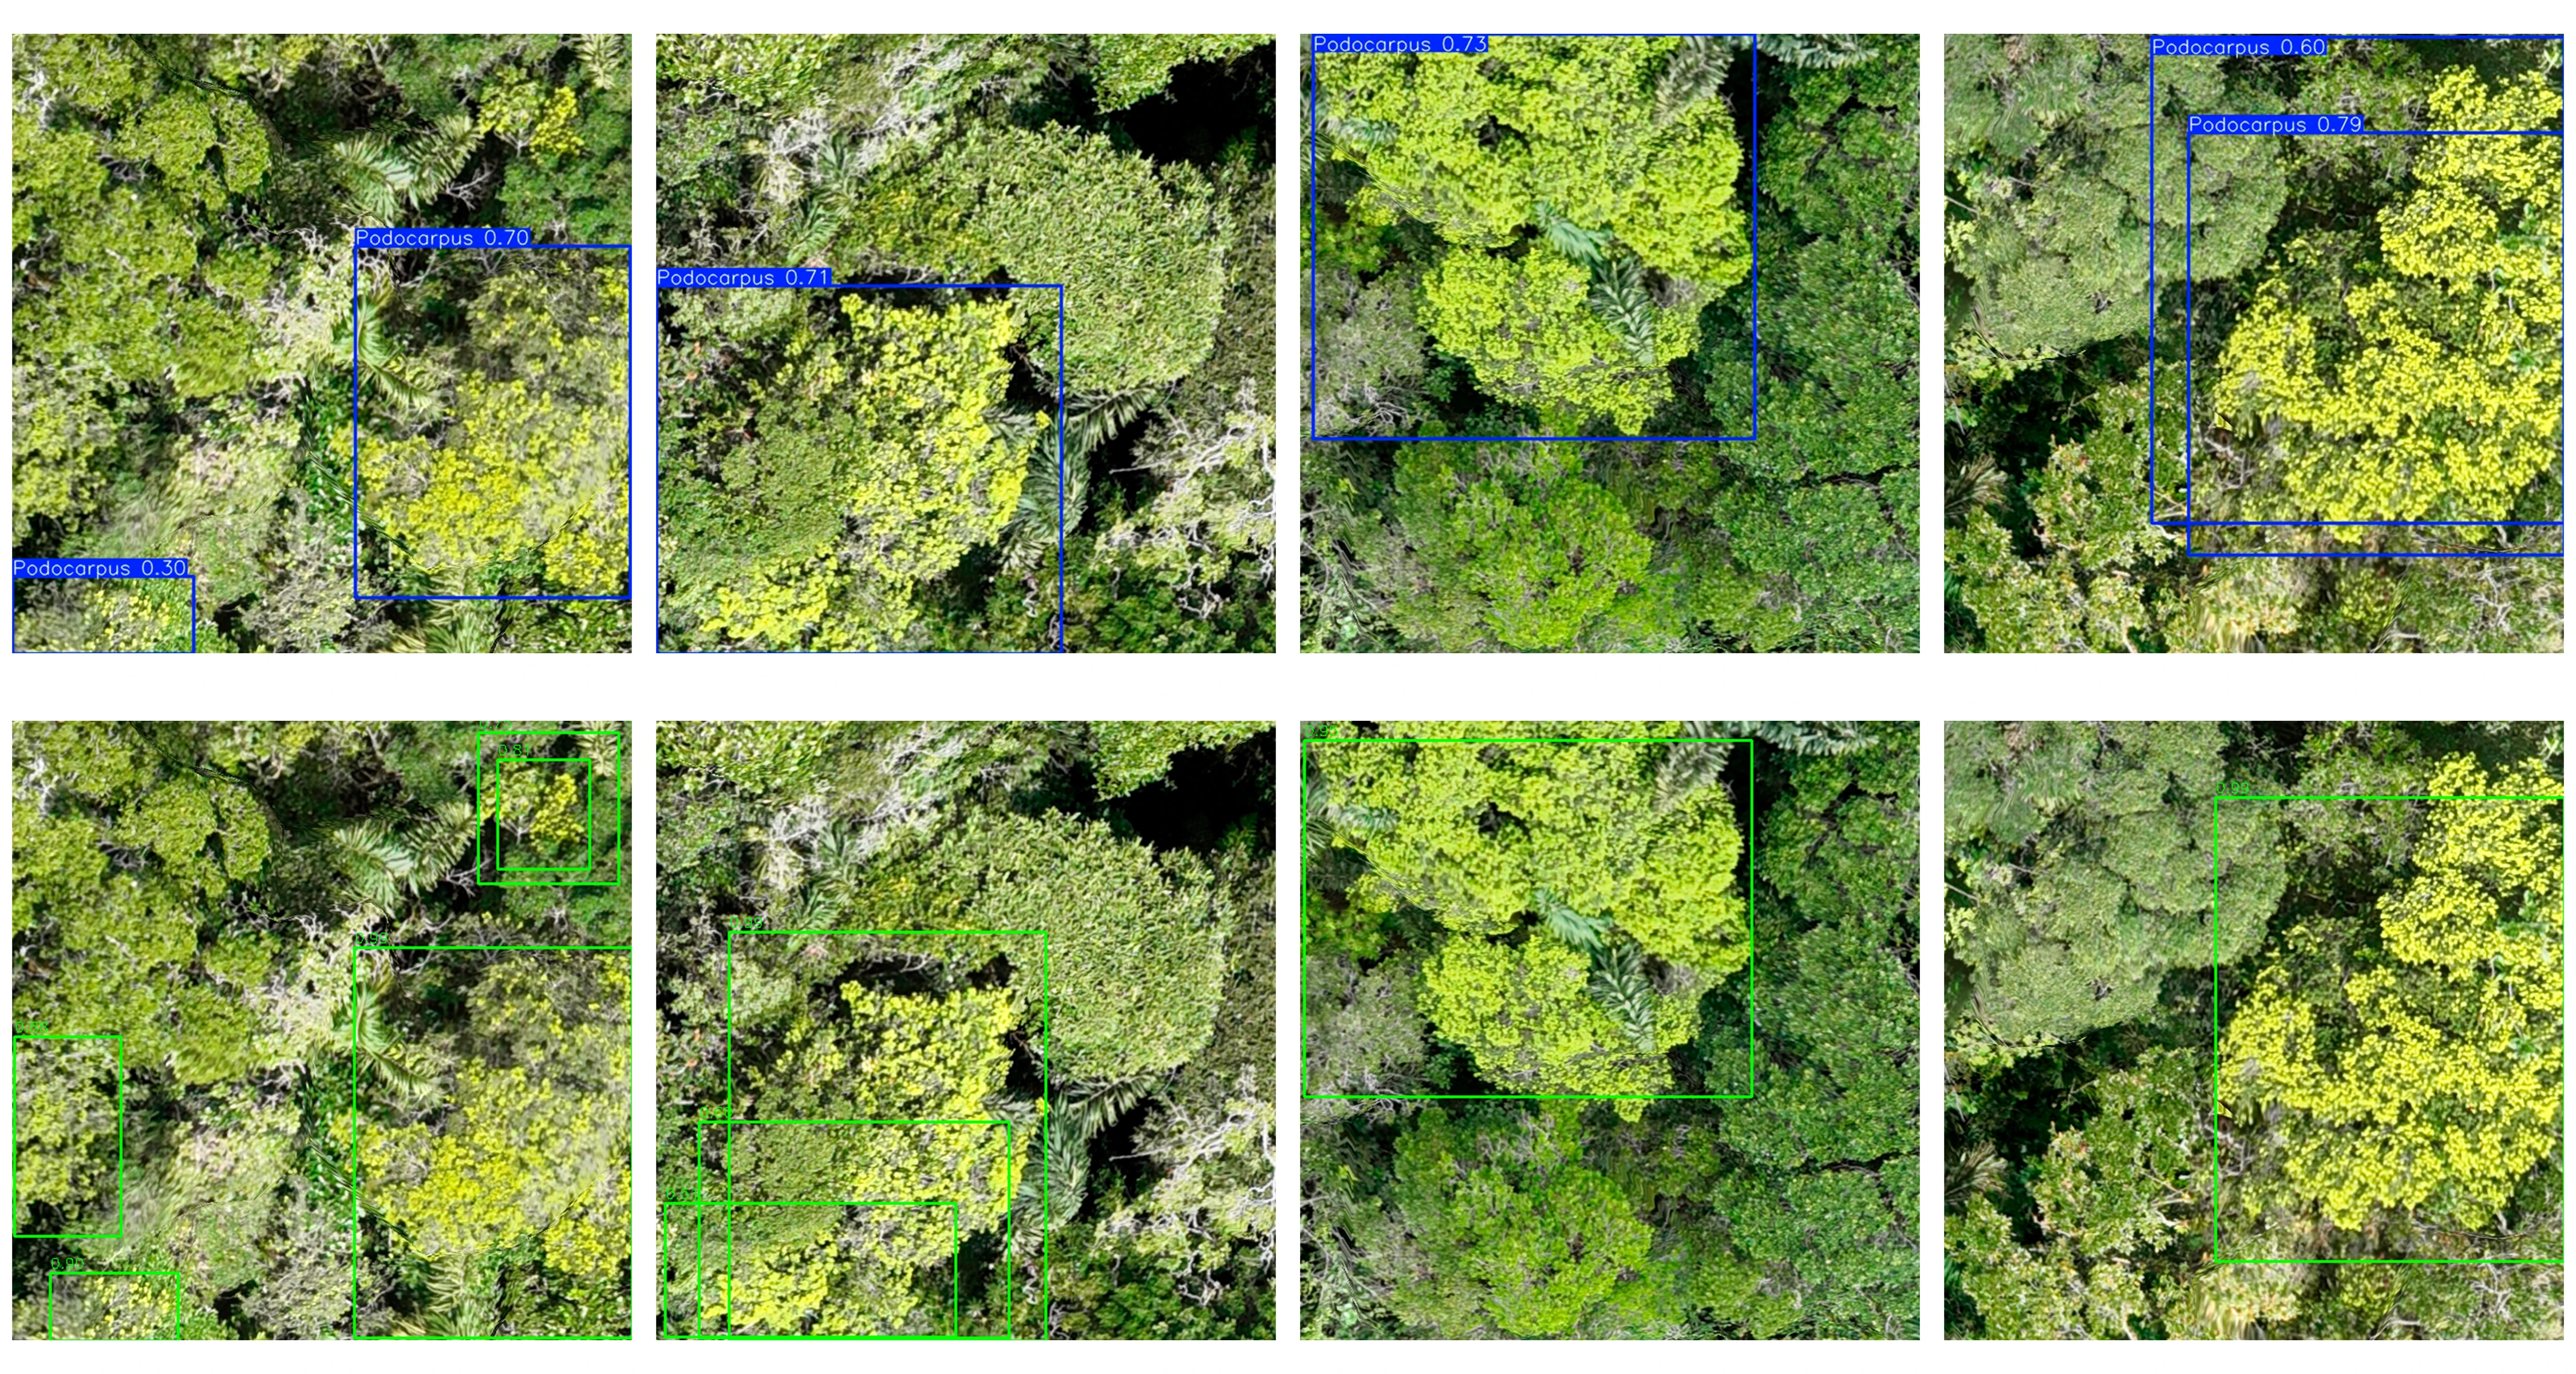
When evaluated using the standard IoU ≥ 0.50 criterion, Faster R-CNN appeared to underperform, largely due to the irregular geometry and coarse manual delineation of Podocarpus crown boundaries. To provide a more ecologically realistic assessment of detection performance, three alternative matching criteria were applied: a relaxed IoU threshold (≥ 0.30), a centroid-based "center-hit" rule, and a dilated IoU criterion with a 15% buffer around ground-truth boxes (Table 2).
Using IoU ≥ 0.30, the model achieved its optimal balance between precision and recall, with an F1-score of 0.82 at a confidence threshold of 0.83. Precision reached 0.79 and recall 0.86, corresponding to 61 true positives, 16 false positives, and 10 false negatives. The center-hit rule further emphasized precision, yielding the highest precision (0.85) and an F1-score of 0.83, while reducing false positives to 10, albeit with a slight decrease in recall (0.82). In contrast, the dilated IoU criterion increased tolerance for irregular crown shapes but resulted in lower precision (0.72) and an F1-score of 0.76, reflecting an increase in false positives (n = 23), despite maintaining a recall of 0.82.
Table 2. Performance of the Faster R-CNN model under alternative evaluation criteria designed to account for irregular crown geometry and annotation uncertainty.
| Evaluation criterion | Confidence threshold | Precision | Recall | F1-score | TP | FP | FN |
|---|---|---|---|---|---|---|---|
| IoU ≥ 0.30 | 0.83 | 0.79 | 0.86 | 0.82 | 61 | 16 | 10 |
| Center-hit | 0.88 | 0.85 | 0.82 | 0.83 | 58 | 10 | 13 |
| Dilated IoU (+15%) | 0.80 | 0.72 | 0.82 | 0.76 | 58 | 23 | 13 |
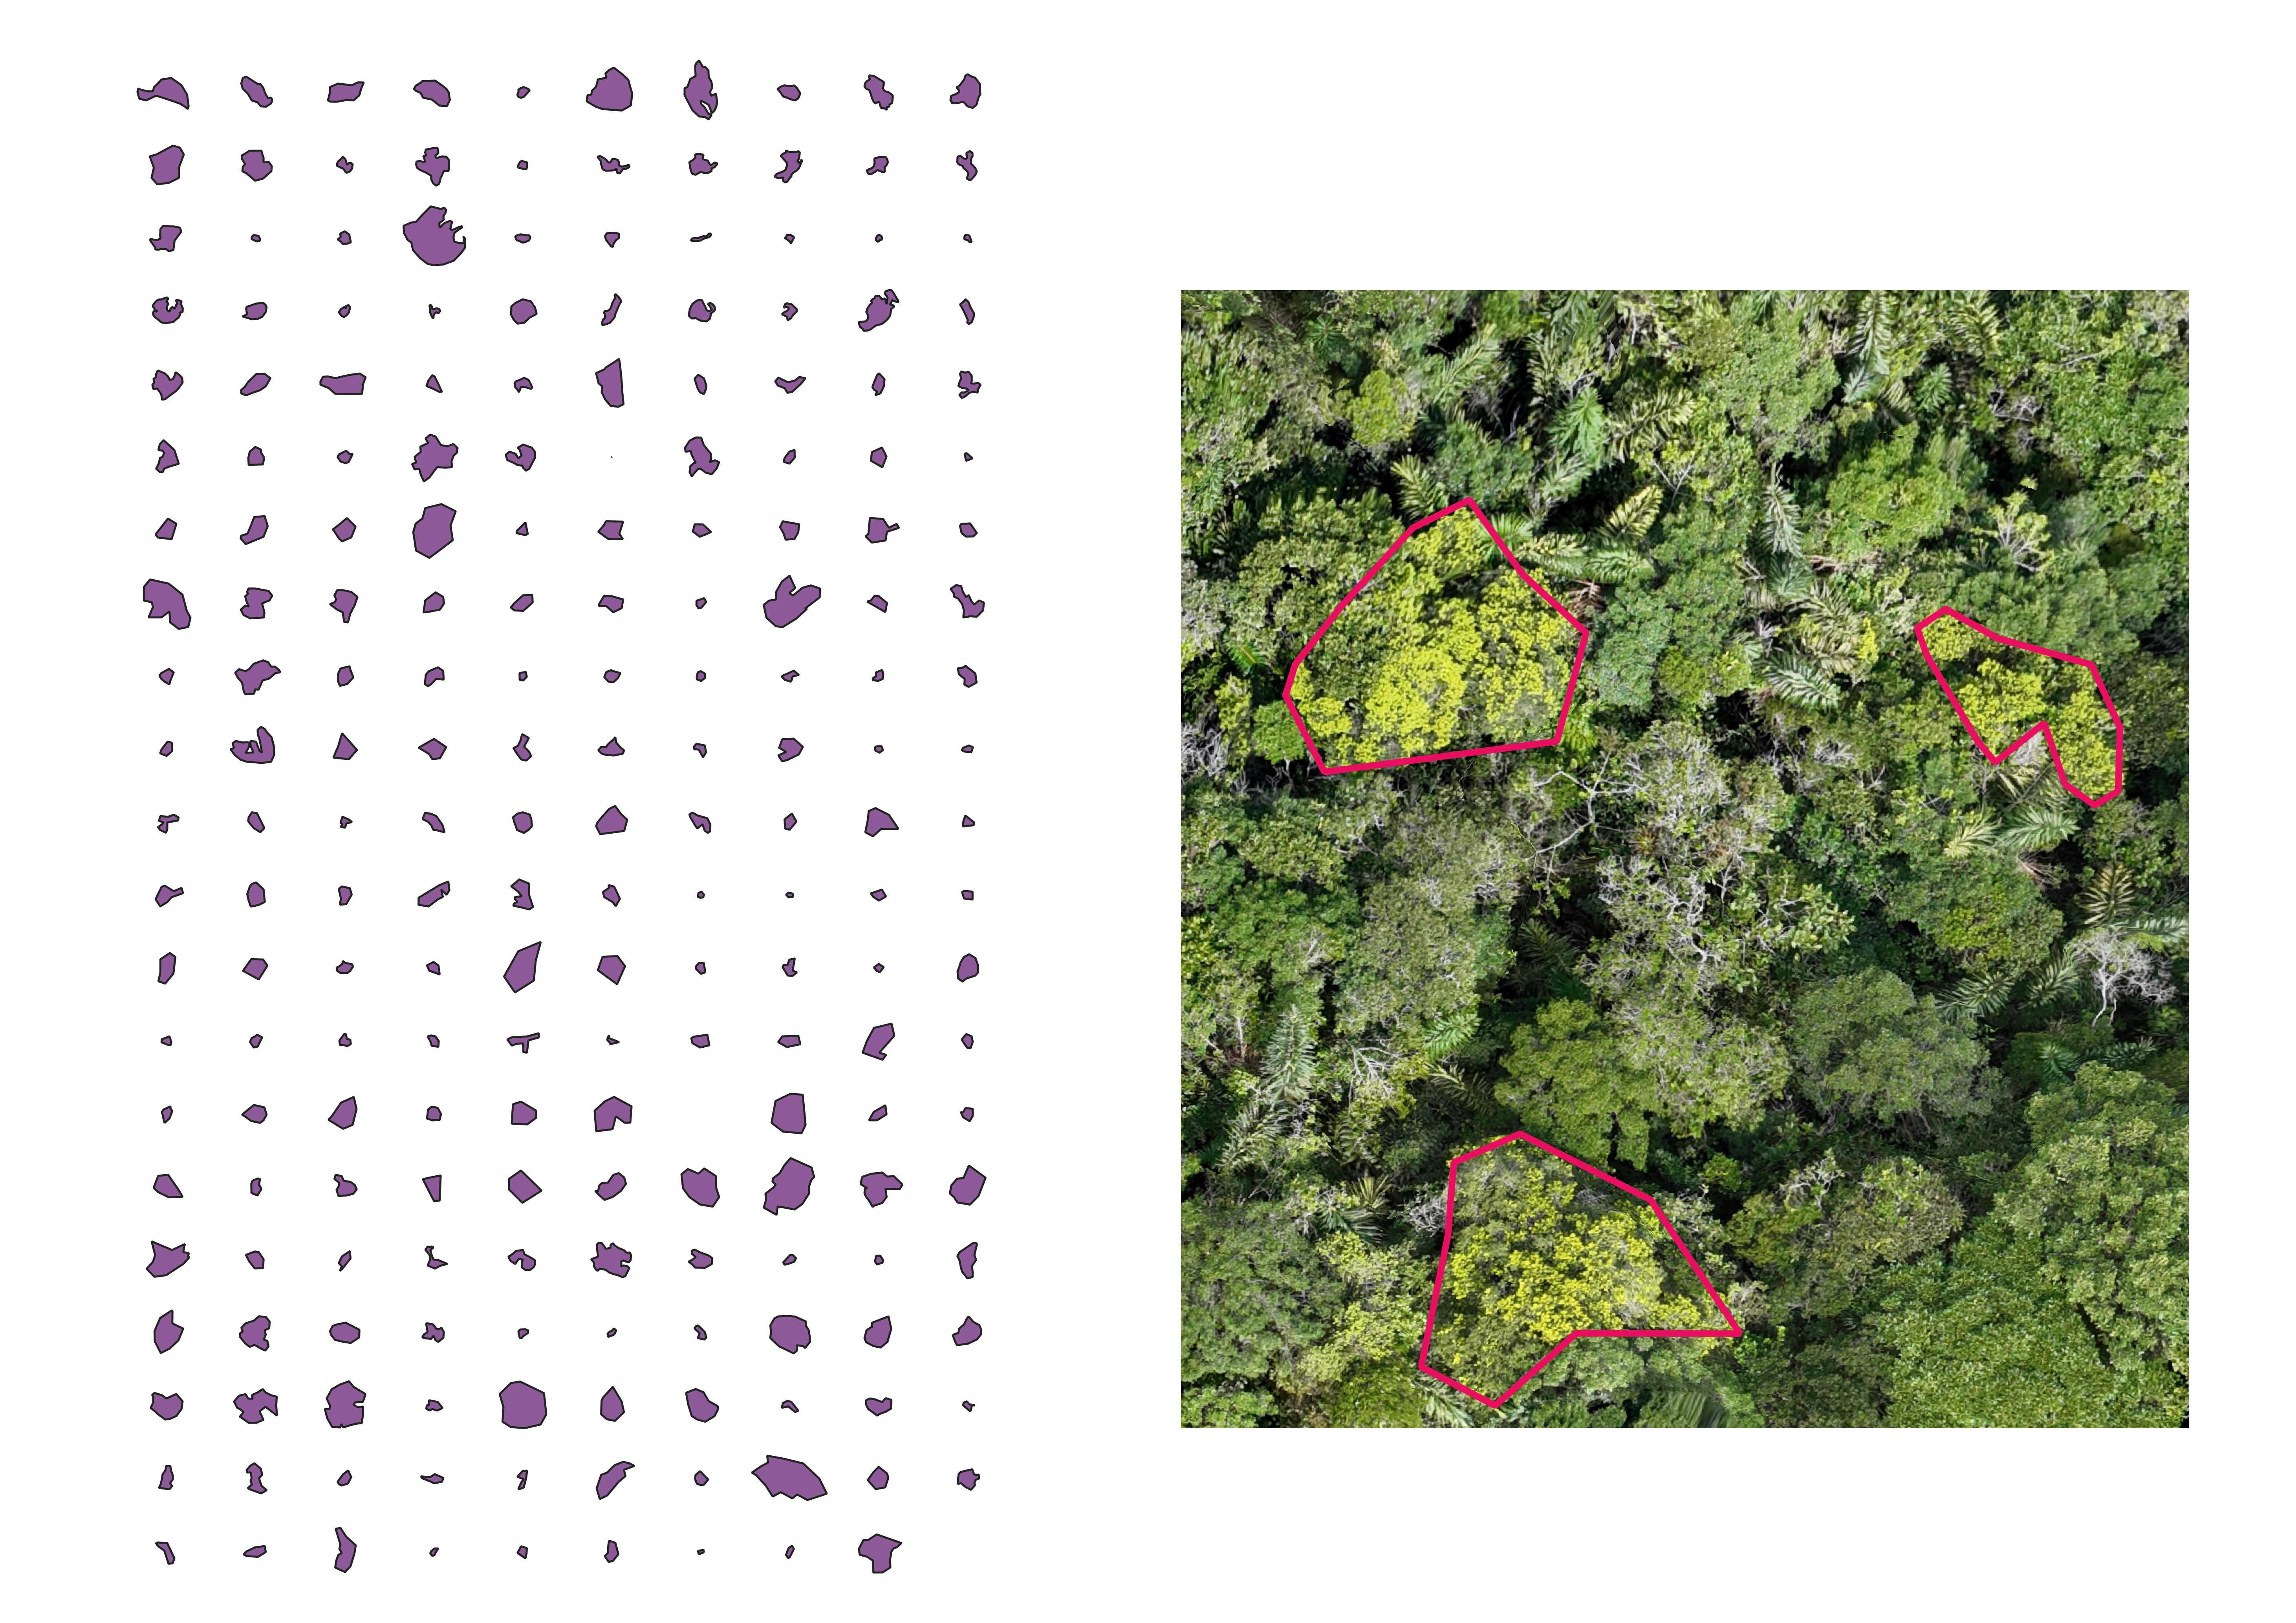
A total of 207 Podocarpus oleifolius crowns were identified within the mapped area, corresponding to a canopy density of 2.31 crowns ha⁻¹. At the stand level, P. oleifolius crowns occupied only a small proportion of the landscape, with an estimated canopy cover of 0.42%.
Descriptive statistics of crown geometry revealed pronounced heterogeneity in both size and form (Table 3). Crown areas ranged from < 1 m² in suppressed individuals to > 100 m² in dominant trees, with a mean area of 16.57 m². Perimeter values were similarly variable (mean = 16.13 m), reflecting a continuum from compact to highly irregular crown outlines. The shape index averaged 1.24, indicating consistent deviation from circularity, while Polsby–Popper compactness values (mean = 0.68) suggested moderate departures from round shapes. Fractal dimension estimates (D = 0.41–2.44, box-counting) further highlighted the structural complexity and irregularity of crown boundaries.
Table 3. Descriptive statistics of crown geometry of Podocarpus oleifolius in the study area.
| Statistic | Mean | SD | Minimum | Maximum |
|---|---|---|---|---|
| Area (m²) | 16.57 | 17.08 | 0.75 | 100.36 |
| Perimeter (m) | 16.13 | 8.77 | 3.63 | 52.68 |
| Shape Index (SI) | 1.24 | 0.16 | 1.04 | 1.83 |
| Compactness (PP) | 0.68 | 0.15 | 0.30 | 0.93 |
The spatial distribution of P. oleifolius individuals was strongly aggregated. Nearest-neighbour analysis yielded an observed mean inter-crown distance of 16.2 m, approximately half of the expected distance under a random spatial pattern (30.8 m). This resulted in a Nearest-neighbour Index of 0.53 and a highly negative Z-score (−13.06), indicating a significant departure from spatial randomness. Consistent with this pattern, Morisita's index (Iₚ = 8.01) provided additional evidence of pronounced clustering, with individuals concentrated in discrete patches rather than evenly distributed across the landscape.
Second-order spatial analyses corroborated clustering across multiple spatial scales. Ripley's K and L functions exhibited positive H(r) values up to 134 m, demonstrating that aggregation extended beyond local neighbourhoods and persisted at broader spatial scales. Cluster analysis identified two main groups of crowns and a small number of isolated outliers, with the largest cluster containing the majority of individuals. Within clusters, crown metrics remained highly variable: crown area and perimeter spanned wide ranges, and compactness values distinguished more circular from elongated crown forms. Orientation analysis based on minimum bounding rectangles yielded a high normalized Shannon entropy (≈ 0.86), indicating largely isotropic crown elongation with no evidence of preferential alignment related to slope aspect or prevailing wind directions.
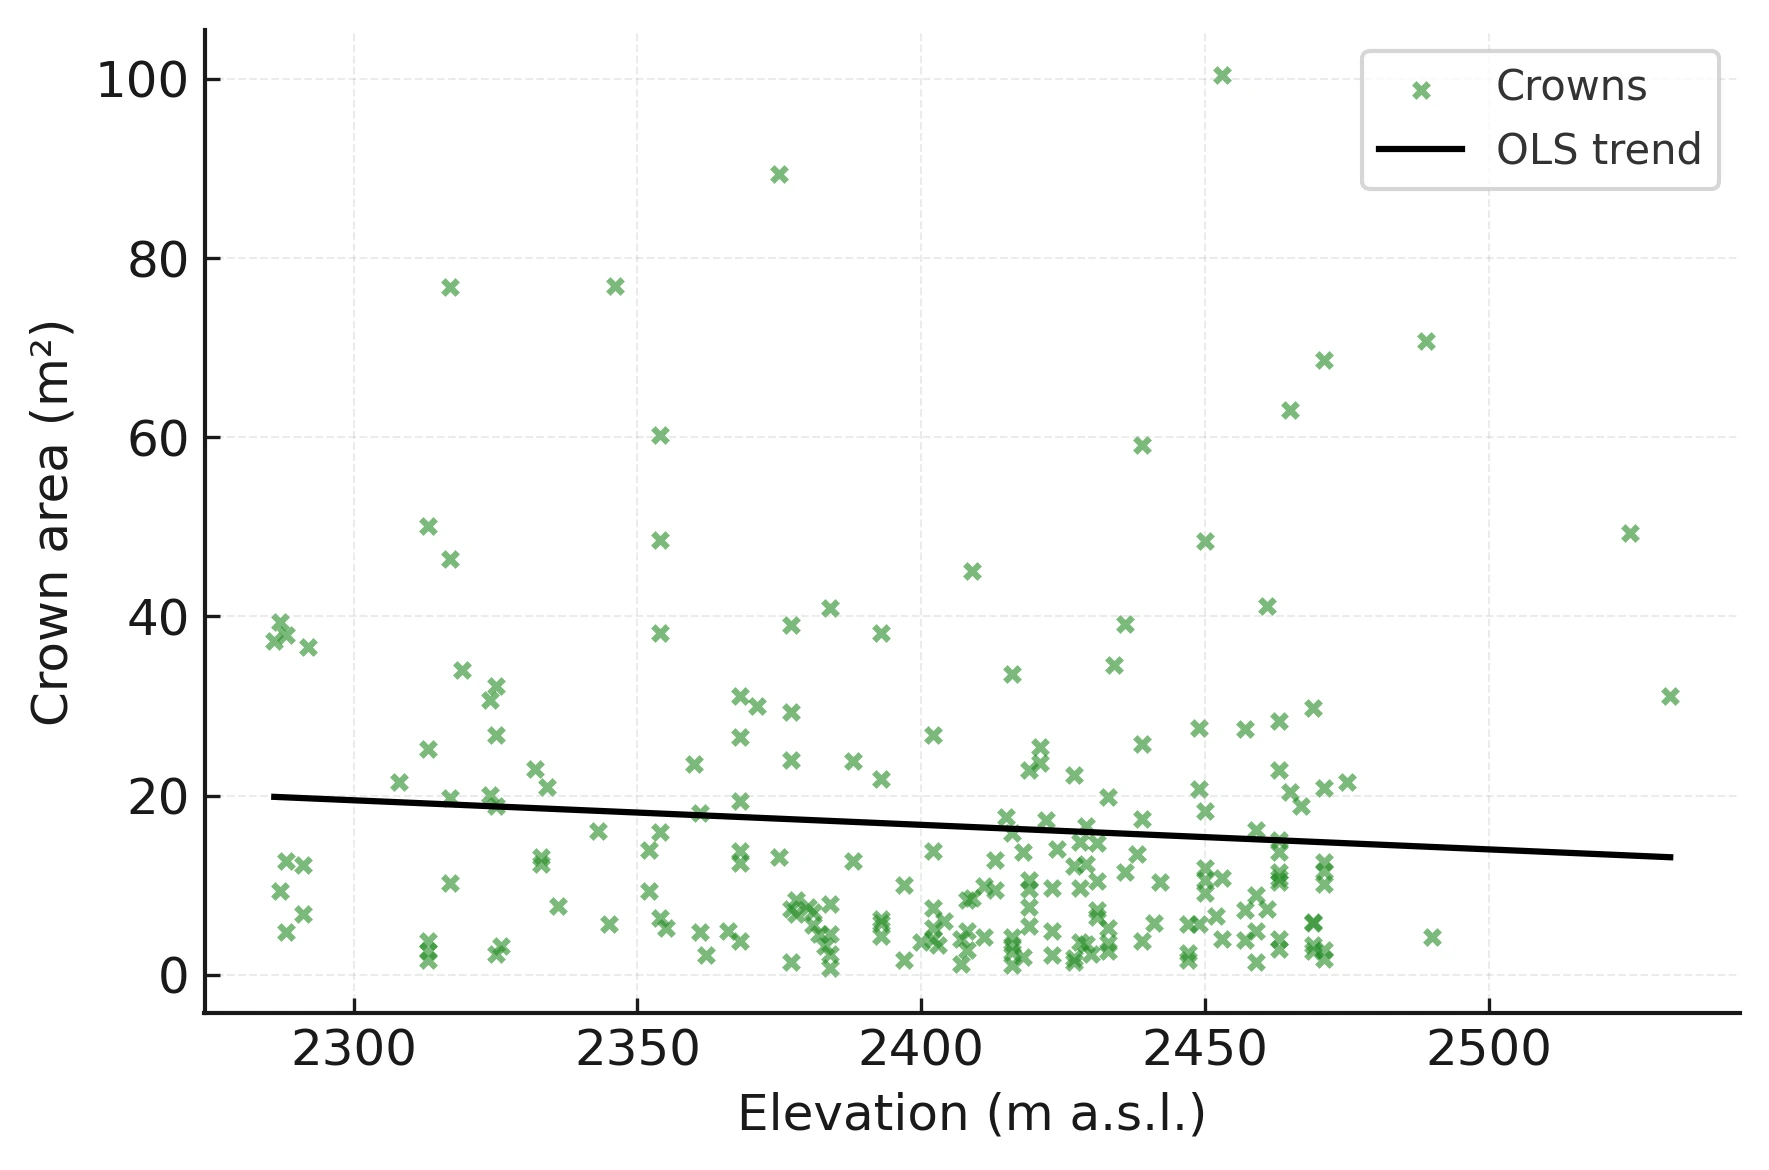
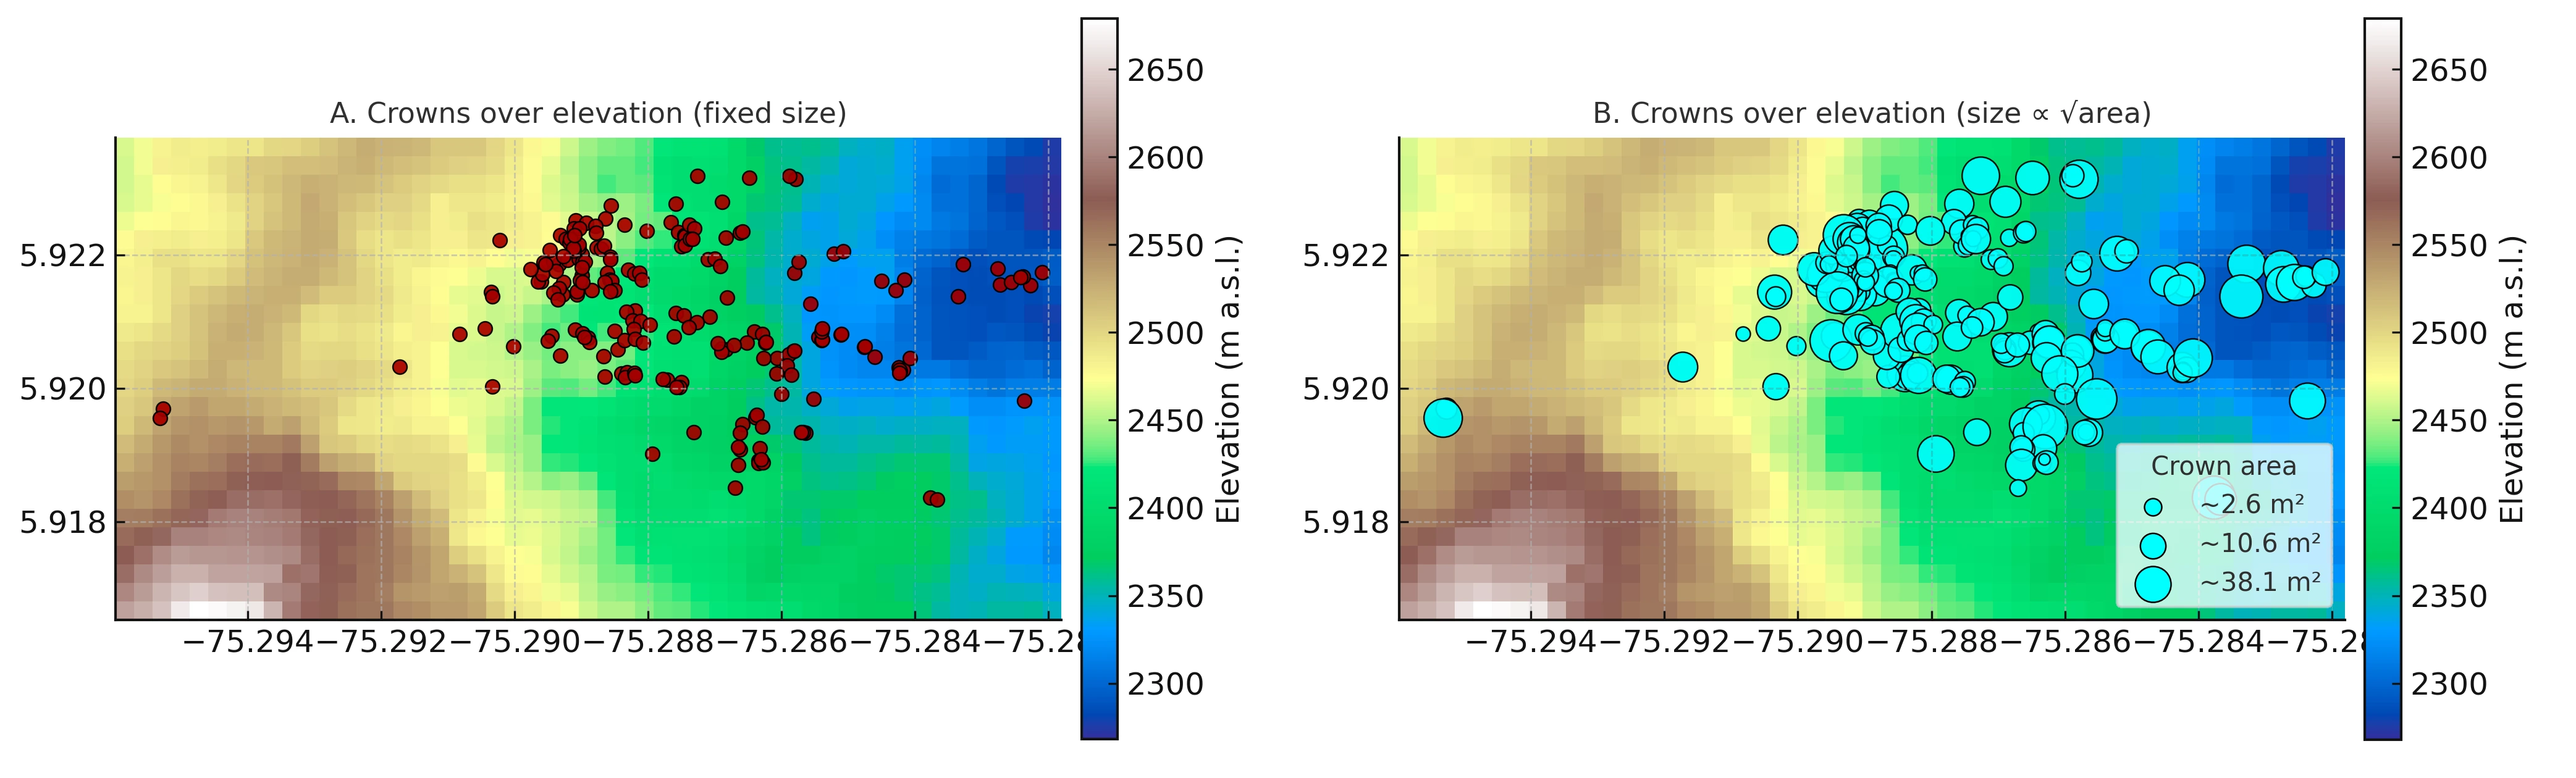
Relationships between crown morphology and environmental gradients were generally weak (Table 4). Crown area showed little association with elevation within the sampled range, suggesting that vertical position in the landscape did not strongly influence crown expansion at the spatial scale considered. Similarly, slope was not correlated with crown compactness or fractal dimension, indicating that local terrain inclination did not systematically affect crown shape complexity or elongation. Slope aspect spanned nearly the full 360°, and the consistently high entropy of crown orientations further supported the absence of a topographically driven directional pattern.
Table 4. Spearman correlations between crown metrics and topographic gradients.
| Area | PP compactness | Fractal dimension | Elevation | Slope | |
|---|---|---|---|---|---|
| Area | 1.00 | −0.20 | 0.02 | −0.09 | −0.02 |
| PP compactness | −0.20 | 1.00 | 0.67 | −0.02 | −0.08 |
| Fractal dimension | 0.02 | 0.67 | 1.00 | 0.03 | −0.03 |
| Elevation | −0.09 | −0.02 | 0.03 | 1.00 | 0.27 |
| Slope | −0.02 | −0.08 | −0.03 | 0.27 | 1.00 |
Discussion
Crown architecture and spatial arrangement are key determinants of canopy structure, light interception, and competitive dynamics in forest ecosystems (Purves et al., 2007; Shenkin et al., 2020). Using UAV-derived crown delineation, this study shows that Podocarpus oleifolius exhibits strongly aggregated spatial distributions and pronounced heterogeneity in crown size and shape within an Andean montane forest.
The clustered distribution of crowns, supported by a Nearest-neighbour Index of 0.53, a highly negative Z-score, Morisita's index of 8.01, and positive Ripley's H(r) values up to 134 m, indicates that individuals are concentrated in discrete patches rather than randomly distributed. Such aggregation is consistent with spatially constrained recruitment, localized microsite suitability, and legacy effects of disturbance or selective logging, all of which are common in fragmented montane forests. The persistence of clustering across multiple spatial scales suggests that aggregation is not limited to local neighbourhood effects but reflects broader stand-level structuring.
Crown geometry further revealed substantial variability in individual growth strategies. Crown area ranged from < 1 m² to > 100 m², and shape indices consistently departed from circularity, with fractal dimension values indicating complex and irregular crown boundaries. This wide variation likely reflects strong crown plasticity driven by asymmetric competition for light, where individuals expand laterally toward canopy openings. Similar relationships between competition and crown asymmetry have been documented in conifer systems, where neighbour shading exerts a dominant influence on crown development (Owen et al., 2021).
Despite this heterogeneity, crown morphology exhibited weak associations with topographic gradients. Crown size, compactness, and complexity were largely independent of elevation and slope, and crown orientation showed high Shannon entropy (≈ 0.86), indicating isotropic elongation without directional bias. These results suggest that, at the spatial scale examined, local competitive interactions and individual growth history exert a stronger influence on crown form than broad-scale terrain variables, consistent with general models of canopy plasticity and gap-driven forest dynamics (Purves et al., 2007; Shenkin et al., 2020).
Both YOLOv11x and Faster R-CNN achieved high detection accuracy for P. oleifolius crowns, despite irregular crown geometry and uncertainty in manual annotations. The YOLO model exhibited high precision (0.91) and recall (0.84), reflecting conservative detection behaviour well suited for species-specific crown inventories in structurally complex canopies.
For Faster R-CNN, strict IoU ≥ 0.50 criteria underestimated performance due to geometric mismatch between predicted and manually delineated crowns. When evaluation metrics were adjusted to reflect ecological realism — using relaxed IoU (≥ 0.30) or a centroid-based center-hit rule — the model consistently achieved high F1-scores (0.82–0.83). The center-hit criterion maximized precision, while relaxed IoU improved recall, highlighting a trade-off between detection confidence and completeness.
These results underscore the importance of adapting evaluation metrics for ecological remote sensing applications. Unlike engineered objects, tree crowns lack well-defined boundaries, and strict geometric overlap may not correspond to functional detection success. Metrics that account for annotation uncertainty and crown irregularity provide a more realistic assessment of model performance for biodiversity monitoring and forest inventory applications.
UAV-based crown delineation has advanced rapidly, particularly when combined with LiDAR or hyperspectral data (Weinstein et al., 2021). However, many studies prioritize segmentation accuracy over ecological interpretation. In this study, UAV-derived crown polygons enabled quantitative analysis of crown geometry and spatial structure, providing insights into the ecological organization of P. oleifolius stands.
The observed crown forms likely reflect contrasting competitive environments. Large, irregular crowns are indicative of greater light access and reduced competition, whereas small, compact crowns likely correspond to suppressed individuals within dense canopy patches. The densely branched architecture characteristic of P. oleifolius is consistent with adaptation to montane cloud forest conditions, where wind exposure and mechanical constraints shape crown development.
The strong aggregation of crowns combined with high within-cluster variability suggests that crown morphology encodes information about local neighbourhood interactions rather than uniform environmental gradients. This highlights the potential of UAV-derived crown metrics as proxies for competitive status and stand structure in remote or inaccessible forests.
While RGB imagery was sufficient for accurate crown detection in this study, species discrimination in tropical forests remains constrained by spectral similarity among co-occurring taxa. Coniferous species are often more readily identifiable than broadleaf species due to their relatively consistent crown texture and coloration (Beloiu et al., 2023; Fricker et al., 2019). Importantly, the detectability assessment highlights a practical advantage of low-altitude UAV imagery for canopy-dominant species in closed tropical forests. Because UAV imagery is acquired directly above the canopy, it provides unobstructed views of live foliage, crown texture, and branching architecture that are often inaccessible from ground-based observations beneath a closed canopy. Under these conditions, low-altitude aerial imagery can yield clearer and more informative visual cues for species recognition than field observations conducted at ground level. Although such image-based identification does not replace taxonomic verification through direct field measurements, it provides a robust and operationally realistic basis for expert crown identification in remote montane forests where traditional ground validation is logistically constrained.
Limitations
Several limitations delimit the scope of inference of this study and should be considered when interpreting the results. Species identification and crown delineation were based on expert visual interpretation of UAV RGB imagery rather than independent field-based verification (e.g., GPS-referenced individuals or dendrometric measurements). Although annotation reliability was supported by a controlled detectability assessment demonstrating that Podocarpus oleifolius crowns could be unambiguously recognized at low flight altitudes above the canopy, model performance ultimately reflects consistency with image-based annotations rather than absolute taxonomic confirmation on the ground.
The study was further constrained to a single montane forest site, acquired under specific environmental, phenological, and illumination conditions, which may limit transferability to other regions or forest types without additional training and validation. Moreover, evaluation metrics were adapted to account for irregular crown geometry and annotation uncertainty by employing relaxed IoU thresholds and centroid-based matching; while ecologically meaningful, these criteria reduce direct comparability with studies relying strictly on conventional object detection benchmarks. Finally, despite extensive data augmentation, the effective number of original annotated crowns remains modest, and augmentation cannot substitute for ecological variability across sites or stand conditions. Consequently, this work is best interpreted as a proof-of-concept demonstrating the feasibility of UAV-based, species-focused crown detection and spatial analysis in structurally complex tropical montane forests, rather than as a definitive species-mapping solution.
Applied value
At local and regional scales, however, the approach demonstrated here provides substantial applied value. By enabling rapid, spatially explicit detection of Podocarpus oleifolius from UAV imagery, this framework allows researchers, conservation practitioners, and public environmental authorities to identify population hotspots, assess spatial patterns of persistence, and detect areas potentially affected by selective logging or forest degradation. Because canopy-dominant, long-lived tree species often act as ecological anchors for montane forest structure, their mapped distributions can serve as proxies for broader habitat integrity. Moreover, once additional visually distinctive or conservation-relevant canopy species are incorporated, the same workflow can support preliminary zonification of priority forest refugia, guiding field surveys, restoration planning, and enforcement efforts. In this sense, even without exhaustive ground validation, UAV-based species detection offers a pragmatic and scalable decision-support tool for conservation management in remote Andean landscapes.
The autonomous detection and mapping of Podocarpus oleifolius crowns from UAV imagery, without reliance on extensive ground measurements, nevertheless represents a substantial advance for conservation monitoring in remote Andean forests. This approach complements recent local efforts to characterize plant community composition (Montoya-López, 2025; Montoya-López & Bota-Sierra, 2023; Montoya-López & Lehnert, 2024) and demonstrates the feasibility of scalable, species-level inventories derived from UAV data.
Conclusion
This study demonstrates the feasibility of combining high-resolution UAV imagery with deep learning–based object detection to identify and characterize individual crowns of a threatened conifer within a structurally complex Andean montane forest. By integrating species-focused detection with quantitative analyses of crown geometry and spatial pattern, the approach moves beyond purely technical performance metrics and provides ecologically interpretable information on population structure and canopy organization. The results highlight the importance of adapting evaluation criteria to biological objects with irregular and uncertain boundaries, reinforcing the need for ecologically meaningful metrics in remote sensing–based forest studies.
From a conservation and management perspective, the workflow presented here offers a practical decision-support tool for identifying population hotspots, assessing spatial aggregation, and prioritizing areas for field verification, protection, or restoration. In regions where access is limited and resources for extensive ground surveys are scarce, UAV-based species detection can substantially enhance the spatial resolution and timeliness of information available to environmental authorities and conservation practitioners, supporting more informed and proactive management of threatened tree species in montane tropical forests.
References
Abreu-Dias R, Santos-Gago JM, Martín-Rodríguez F, Álvarez-Sabucedo LM, 2025. Advances in the automated identification of individual tree species: A systematic review of drone- and AI-based methods in forest environments. Technologies 13 (5).
Albuquerque RW, Vieira DLM, Ferreira ME, Soares LP, Olsen SI, Araujo LS, Vicente LE, Tymus JRC, Balieiro CP, Matsumoto MH et al., 2022. Mapping key indicators of forest restoration in the Amazon using a low-cost drone and artificial intelligence. Remote Sens 14 (4).
Ali ML, Zhang Z, 2024. The YOLO framework: A comprehensive review of evolution, applications, and benchmarks in object detection. Computers 13 (12).
Álvarez-Díaz JC, Ospina-Zapata D, Rojas W, Quijano-Abril MA, 2018. Effect of intensive exploitation and forest fragmentation on the genetic structure of Podocarpus oleifolius in the Colombian Central Andes. Bionatura 3 (3): 649–656.
Ball JGC, Hickman SHM, Jackson TD, Koay XJ, Hirst J, Jay W, Archer M, Aubry-Kientz M, Vincent G, Coomes DA, 2023. Accurate delineation of individual tree crowns in tropical forests from aerial RGB imagery using Mask R-CNN. Remote Sens Ecol Conserv 9 (5): 641–655.
Beloiu M, Heinzmann L, Rehush N, Gessler A, Griess VC, 2023. Individual tree-crown detection and species identification in heterogeneous forests using aerial RGB imagery and deep learning. Remote Sens 15 (5): 1463.
CORNARE, 2016. Reserva Forestal Protectora Regional de los Cañones de los Ríos Melcocho y Santo Domingo. Plan de Manejo. Corporación Autónoma Regional de las Cuencas de los Ríos Negro y Nare, Colombia.
Fricker GA, Ventura JD, Wolf JA, North MP, Davis FW, Franklin J, 2019. A convolutional neural network classifier identifies tree species in mixed-conifer forest from hyperspectral imagery. Remote Sens 11 (19): 2326.
Gardner M, 2013. Podocarpus oleifolius. The IUCN Red List of Threatened Species 2013. Available at: https://www.iucnredlist.org [9 Feb 2026].
Garzon-Lopez CX, Miranda A, Moya D, Andreo V, 2024. Remote sensing biodiversity monitoring in Latin America: Emerging need for sustained local research and regional collaboration to achieve global goals. Glob Ecol Biogeogr 33 (4).
Huang Y, Ou B, Meng K, Yang B, Carpenter J, Jung J, Fei S, 2024. Tree species classification from UAV canopy images with deep learning models. Remote Sens 16 (20).
Hussain M, 2023. YOLO-v1 to YOLO-v8: The rise of YOLO and its complementary nature toward digital manufacturing and industrial defect detection. Machines 11 (7).
Leidemer T, Lopez Caceres ML, Diez Y, Ferracini C, Tsou CY, Katahira M, 2025. Evaluation of temporal trends in forest health status using precise remote sensing. Drones 9 (5).
Montoya-López A, 2025. Hidden in the Andes: New insights into the distribution of Magnolia guatapensis and Cyathea antioquensis in Colombia. Check List 21 (4): 658–665.
Montoya-López AF, Bota-Sierra CA, 2023. Magnolia unicarmensis (Magnoliaceae), a new species from tropical montane forests of Antioquia, Colombia. Phytotaxa 626 (1): 41–50.
Montoya-López A, Lehnert M, 2024. Species richness of Cyatheales in the upper Santo Domingo Canyon, Antioquia, Colombia. Check List 20 (5): 1182–1191.
Moura MM, Oliveira LES, Sanquetta CR, Bastos A, Mohan M, Corte APD, 2021. Towards Amazon forest restoration: Automatic detection of species from UAV imagery. Remote Sens 13 (13).
Owen HJF, Flynn WRM, Lines ER, 2021. Competitive drivers of interspecific deviations of crown morphology from theoretical predictions measured with terrestrial laser scanning. J Ecol 109 (7): 2612–2628.
Pereira Martins-Neto R, Garcia Tommaselli AM, Imai NN, Honkavaara E, Miltiadou M, Saito Moriya E, David HC, 2023. Tree species classification in a complex Brazilian tropical forest using hyperspectral and LiDAR data. Forests 14 (5).
Purves DW, Lichstein JW, Pacala SW, 2007. Crown plasticity and competition for canopy space: A new spatially implicit model parameterized for 250 North American tree species. PLoS One 2 (9).
Shenkin A, Bentley LP, Oliveras I, Salinas N, Adu-Bredu S, Marimon-Junior BH, Marimon BS, Peprah T, Choque EL, Trujillo Rodriguez L et al., 2020. Influence of ecosystem and phylogeny on tropical tree crown size and shape. Front For Glob Change 3.
Tagle Casapia X, Cardenas-Vigo R, Marcos D, Fernández Gamarra E, Bartholomeus H, Honorio Coronado EN, Di Liberto Porles S, Falen L, Palacios S, Tsenbazar NE et al., 2025. Effective integration of drone technology for mapping and managing palm species in the Peruvian Amazon. Nat Commun 16 (1).
Topgül ŞN, Sertel E, Aksoy S, Ünsalan C, Fransson JES, 2024. VHRTrees: A benchmark dataset for tree detection in satellite imagery and performance evaluation with YOLO-based models. Front For Glob Change 7.
Weinstein BG, Graves SJ, Marconi S, Singh A, Zare A, Stewart D, Bohlman SA, White EP, 2021. A benchmark dataset for individual tree crown delineation in co-registered airborne RGB, LiDAR and hyperspectral imagery. PLoS Comput Biol 17 (9): e1009180.
Zhong H, Zhang Z, Liu H, Wu J, Lin W, 2024. Individual tree species identification in complex coniferous and broad-leaved mixed forests using UAV LiDAR and RGB imagery. Forests 15 (2).